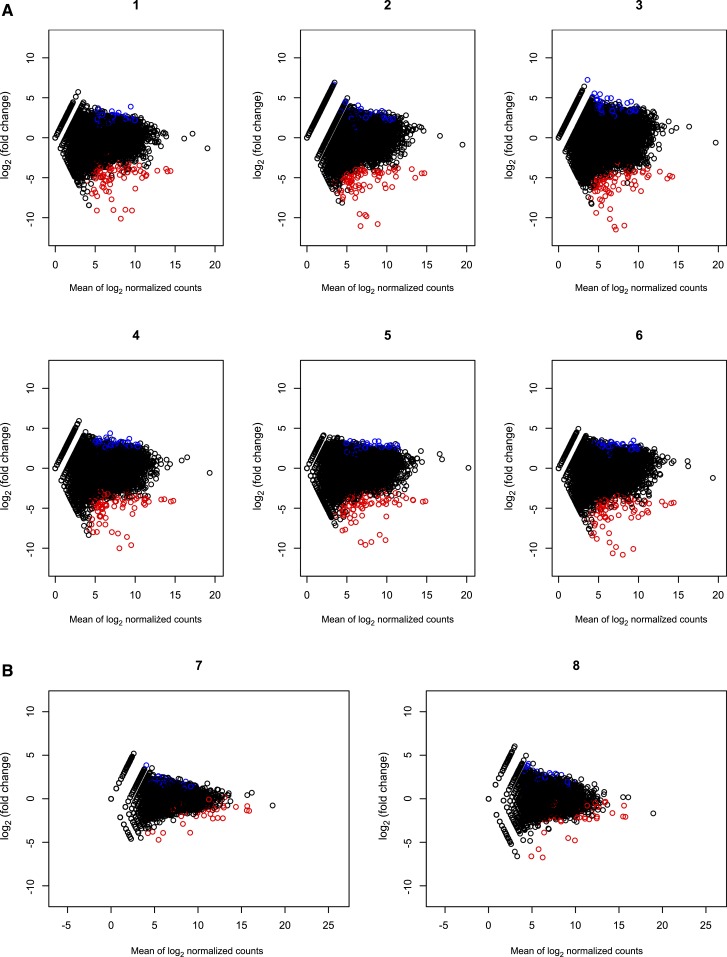
Figure 2.
Count data agreement between the dried blood spot (DBS) and whole blood RNA sources were assessed with Bland–Altman, also known as minus vs. average, plots. Genes with lower average counts, between 0 and 5 on the horizontal axis, show higher dispersion on the vertical axis. This higher dispersion indicates that low-count genes have larger discrepancy between DBS vs. whole blood readings. Dispersion was lower when whole blood RNA was rRNA depleted (B) compared with polyA selected (A) before RNA-seq.

