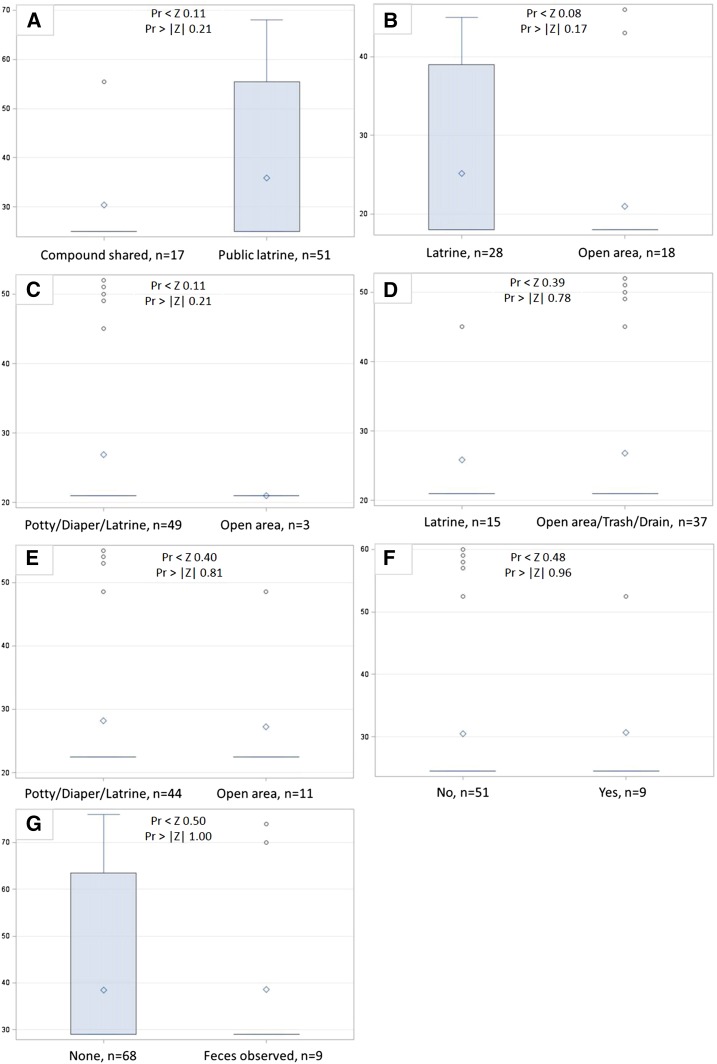
Figure 3.
Wilcoxon rank sum score boxplots of log10 human adenovirus genomic copies (hAdv) per 100 cm2 surface area by (A) level of shared latrine access, (B) defecation location by children 5-12 years, (C) defecation location by children <5 years, (D) disposal location for child feces by caregivers, (E) use of potties by neighbors in compound for <5 child defecation, (F) neighbors in compound leave child feces on ground, and (G) observed human and animal feces on ground. This figure appears in color at www.ajtmh.org.

