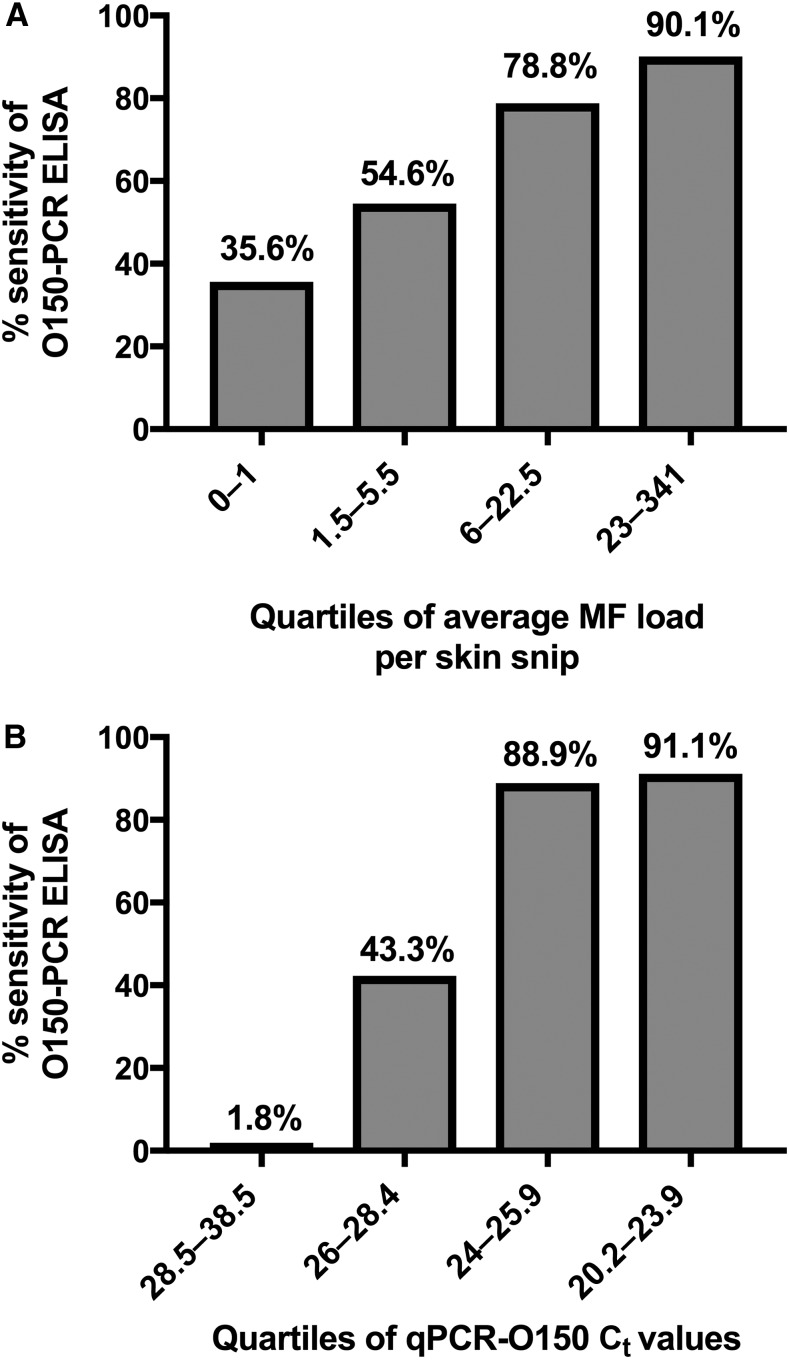
Figure 2.
O150-PCR ELISA demonstrates reduced sensitivity in low-intensity Onchocerca volvulus infections. (A) Decreased O150-PCR sensitivity relative to qPCR-O150 is observed in skin biopsy samples with lower MF loads. Bar graph depicting the percent sensitivity of O150-PCR ELISA relative to qPCR-O150 on the y axis and MF load group on the x axis; samples were divided into quartiles based on MF load. (B) Decreased O150-PCR sensitivity relative to qPCR-O150 is observed in skin biopsy samples with lower concentration of O. volvulus DNA. Bar graph depicting the percent sensitivity of O150-PCR ELISA relative to qPCR-O150 on the y axis and on the x axis; samples were divided into quartiles based on qPCR-O150 cycle threshold (Ct) values.

