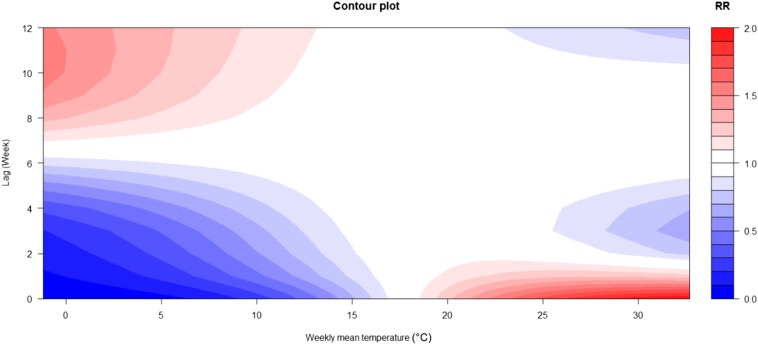
Figure 4.
The contour plots of weekly mean temperature denotes relative risk. Higher temperatures had acute and short-term effects and declined quickly over time, whereas the effects in lower temperature ranges were persistent over longer lag periods. This figure appears in color at www.ajtmh.org.

