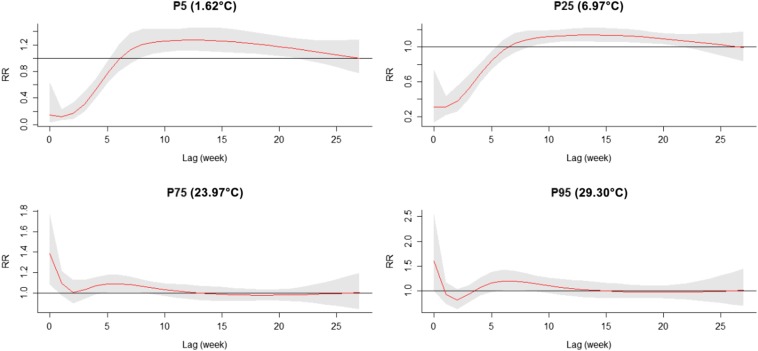
Figure 5.
Plot of relative risk (RR) by lag at specific temperatures. The relationship between temperature and severe fever with thrombocytopenia syndrome (SFTS) showed a different lag pattern and high temperatures had short-term effects. The higher temperatures (23.97°C and 29.30°C) had the maximum RR for SFTS cases on the current week, which decreased quickly during the following weeks. However, the low temperatures (1.62°C and 6.97°C) had the minimum RR on the current week and had the maximum RR at lag 13 weeks, which decreased slowly during the following weeks. This figure appears in color at www.ajtmh.org.

