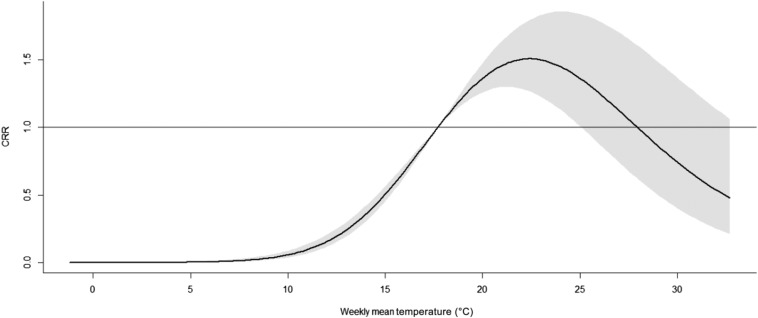
Figure 6.
Overall relative risks of weekly mean temperature for total severe fever with thrombocytopenia syndrome cases over 27 weeks. The exposure–response curve was approximately reversed U-shaped. The relative risk increased with the increment of temperature and reached the peak at 23°C and then turned to decrease. CRR = cumulative relative risk.

