
Fig. 1.
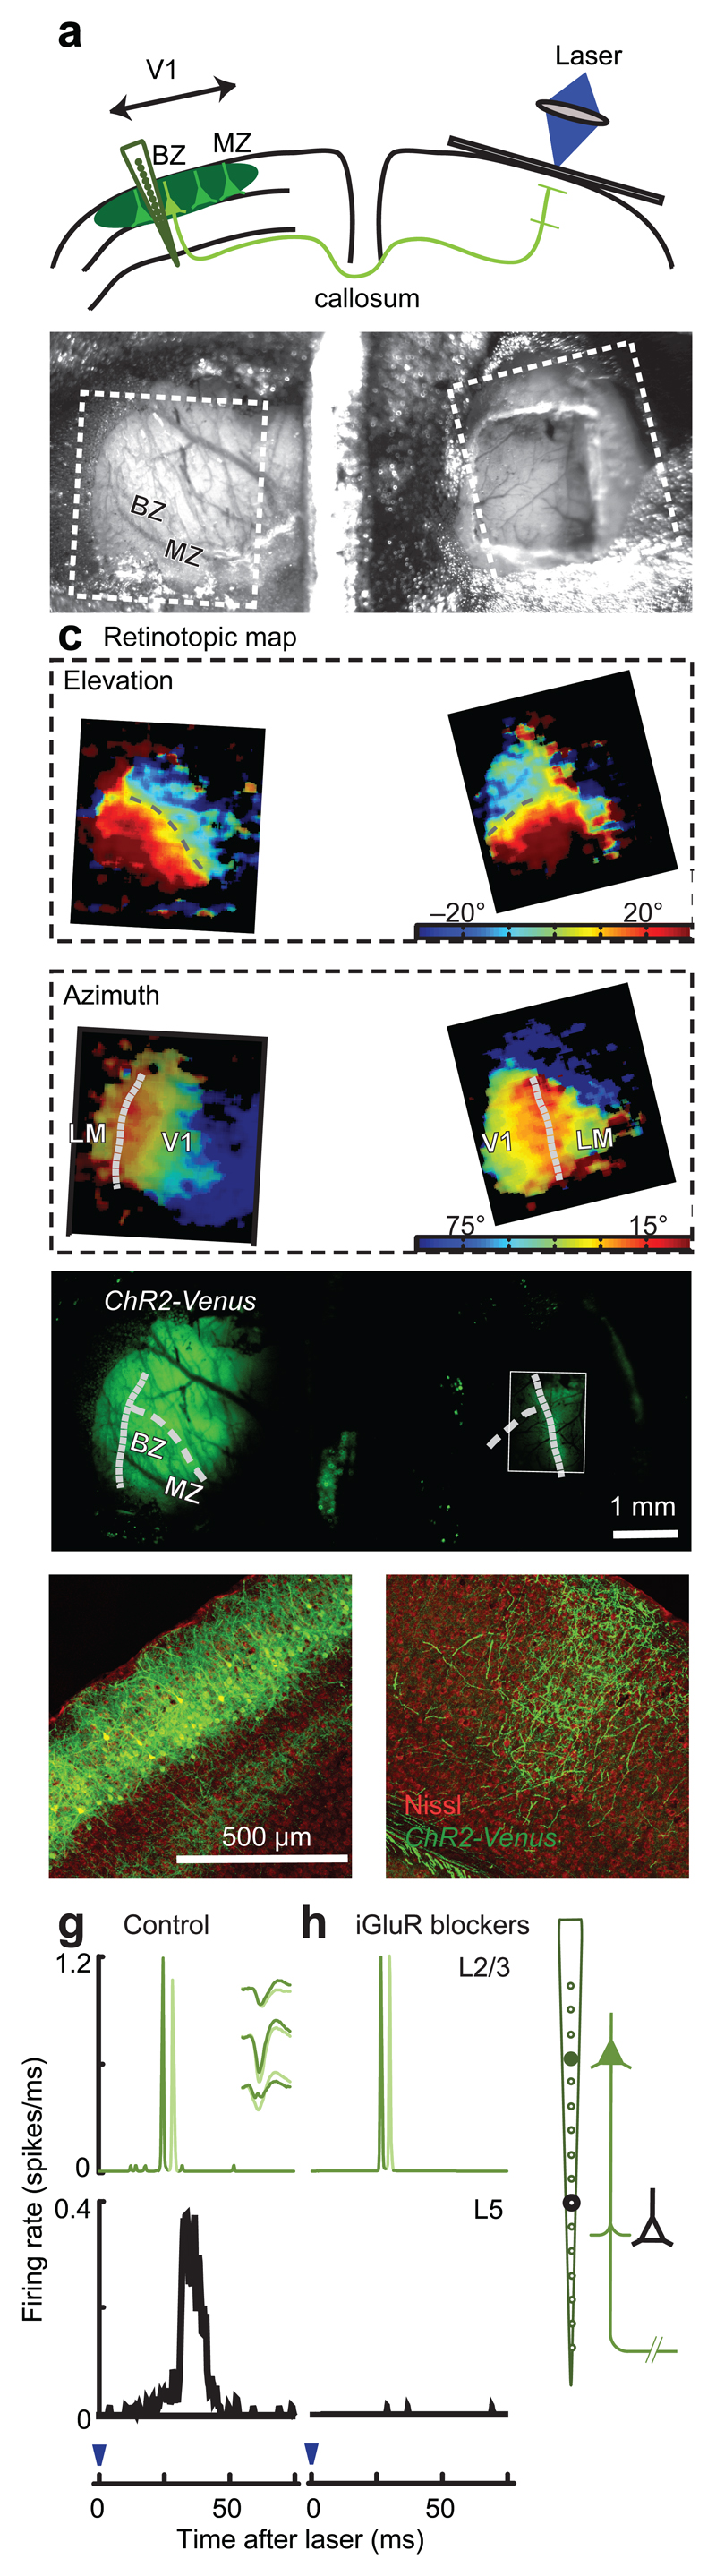
Optogenetic antidromic stimulation for probing cortical connectivity in V1. (a) The targets of optogenetic stimulation are L2/3 neurons in the callosal binocular zone (BZ) in the electroporated hemisphere. MZ: monocular zone. (b) Top view of the chamber allowing access to both hemispheres. Rectangles indicate regions in c. (c) Retinotopic maps obtained via intrinsic imaging. V1 and LM were determined based on reversal of retinotopy. Curves: representation of the vertical meridian (dotted) and horizontal meridian (dashed). (d) Fluorescence image showing expression of ChR2-Venus. Rectangle: callosal band, processed separately to enhance signals. Curves are replotted from c. (e,f) Coronal sections of electroporated (e) and contralateral (f) hemispheres (g) Response histograms for two units in putative L2/3 (top) and one in putative L5 (bottom). Inset: spike shapes of the two units. (g) Same, in the presence of iGluR blockers (CNQX, D-AP5).