
Figure 7. Adult retinoid deficiency induced by GVAD reverses the diet dependence of gene expression.
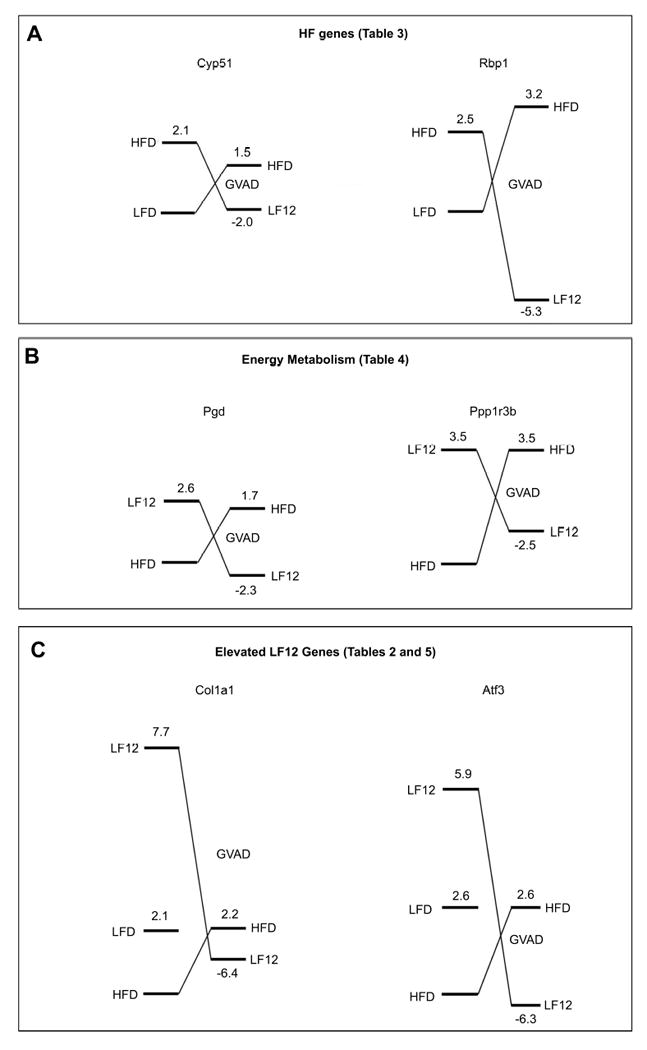
Each diagram presents EDGE3 processed expression ratios relative to a standard diet set to 1.0 (HFD or LFD). The right hand values represent changes induced by GVAD on a HFD or LF12 base diet, scaled proportionately. The levels approximate to the absolute relative Cy3 values for the treatments. (A) HF genes are represented by Cyp51 and Rbp1 (Table 3). (B) Energy metabolism genes are represented by Pgd and Ppp1r3b (Table 4). (C) Elevated LF12 genes are represented by Col1a2 and Atf3 (Tables 2 and 5).