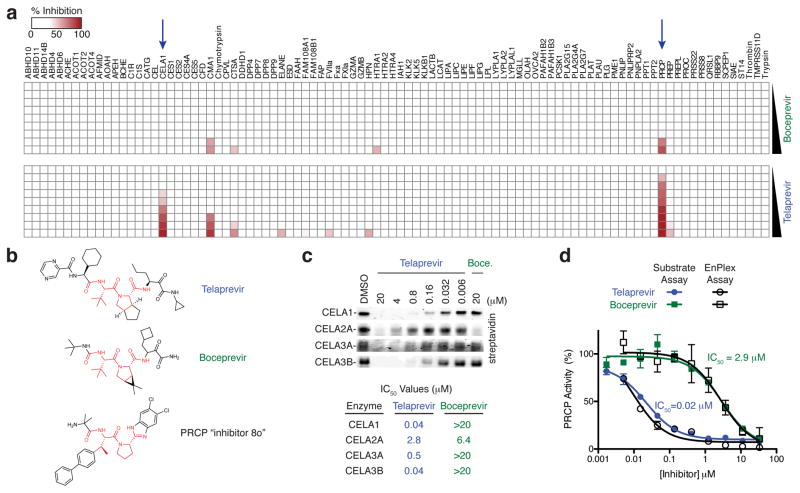
Figure 3.
Comparative selectivity profiling of telaprevir and boceprevir. (a) Complete EnPlex profiles. The blue arrows indicate the enzymes inhibited by telaprevir. (b) Structures of telaprevir, boceprevir, and PRCP inhibitor “compound 8o”. Similar portions of these compounds are colored red. (c) Gel-based competitive ABPP analysis with the FP-biotin probe against the chymotrypsin-like elastases. Full gel images are shown in Supplementary Figure 11. IC50 values determined from three independent experiments are shown. (d) PRCP IC50 curves obtained by EnPlex and by a fluorometric substrate assay. Data are means ± s.e.m of three independent experiments.

