Figure 5.
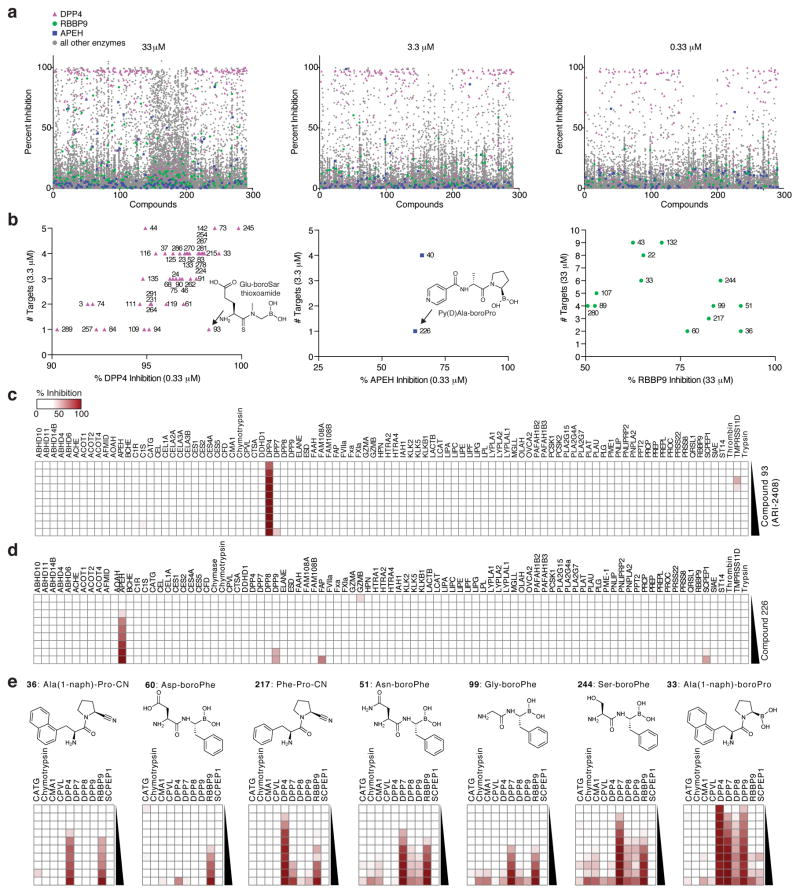
EnPlex analysis of a boronic acid and nitrile compound library. (a) Primary screening of all compounds (numbers correspond to Supplementary Table 6) against all enzymes at three concentrations. DPP4, RBBP9, and APEH are colored as indicated, and all other enzymes are colored gray. (b) Hit compounds for DPP4, APEH, and RBBP9 are displayed according to potency (x-axis) and selectivity (y-axis). “# Targets” refers to the number of enzymes inhibited >50% at the indicated concentration. Complete EnPlex profiles for (c) the DPP4 inhibitor ARI-2408 (from 1.7 nM to 33 μM) and (d) the APEH inhibitor 226 (from 5 nM to 33 μM) are shown. (e) EnPlex profiles for the enzymes inhibited by the most potent RBBP9 inhibitors. These inhibitors have similar potencies against RBBP9, but widely varying selectivities.

