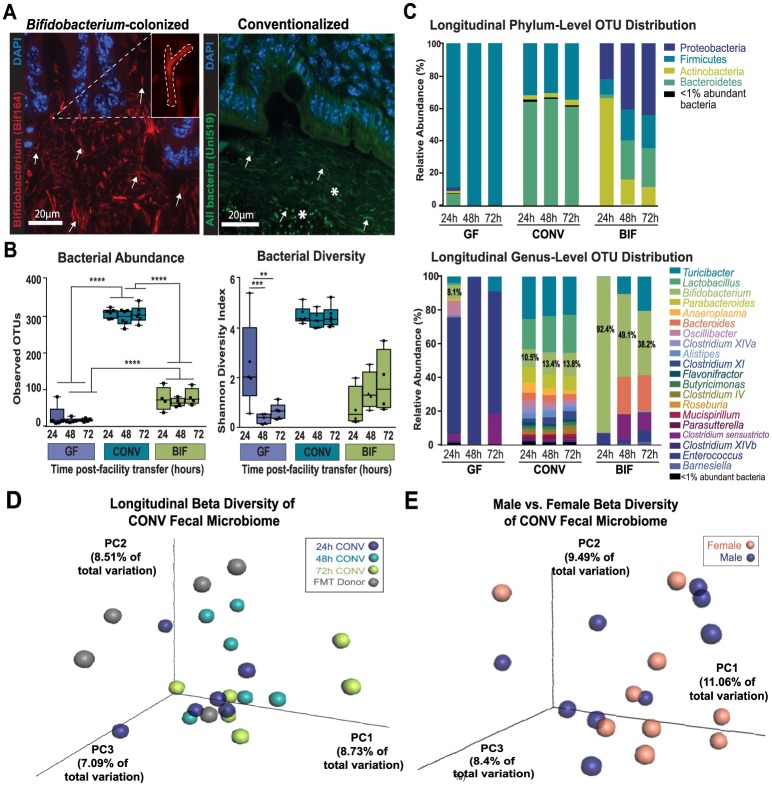
Fig 2. Longitudinal analysis of the gut microbiome in mice from each treatment group.
(A) Representative micrographs from Carnoy’s-fixed and paraffin-embedded intestinal tissue. The left panel image is from the colon of a Bifidobacterium-colonized mouse and shows the result of an in situ hybridization with the Texas Red-labeled, Bifidobacterium genus-specific probe Bif164. The right panel shows colon tissue from a conventionalized mouse that was hybridized with the FITC-labeled universal bacterial probe, Uni519. Nuclei of host intestinal epithelial cells are counterstained in both images using DAPI. Inset in left panel demonstrates “bifid” morphology typical of Bifidobacterium species. White arrows indicate what was considered positive signal versus background in both panels, and white stars highlight the diversity of bacterial species present in the conventionalized mice as shown by the varying morphologies (rod vs. cocci) and localization. Images taken at 60x; scale bar = 20μm. (B) Alpha diversity of microbiota in each treatment group as measured by the Shannon Diversity Index (right panel) and Operational Taxonomic Unit (OTU) richness as measured by number of observed OTUs (left panel) at 24, 48, and 72 hours in each of the cohort groups. (C) Longitudinal relative abundance of OTUs. Phylum—level (Top panel) and Genus-level (Bottom panel) comparisons distributed by mouse group and timepoint post-transfer from gnotobiotic isolators. (D-E) Principal Coordinates Analyses (PCoA) showing (D) stability of the CONV fecal microbiome over time after transfer from gnotobiotic isolators, and (E) similarity between male and female fecal microbiome profiles in the conventionalized cohort. The percentage variation explained by each of the three primary principal factors is indicated on each axis. Coordinates representing individual samples are colored according to group, with distance to other coordinates indicating similarity/dissimilarity. (Data from 24h, 48h, and 72h timepoints in CONV group is combined in this analysis. Additional data detailing diversity by timepoint and sex in CONV group is shown in S1 Fig. Data also shown for other treatment groups parsed by timepoint in S1 Fig). Results presented as mean ± SEM. *p < 0.05, **p<0.01, ***p<0.001. (fecal microbiome analysis: n = 3m/3f per timepoint,t totaling n = 9m/9f per treatment) GF = germ-free, CONV = Conventionalized, BIF = Bifidobacterium-colonized.

