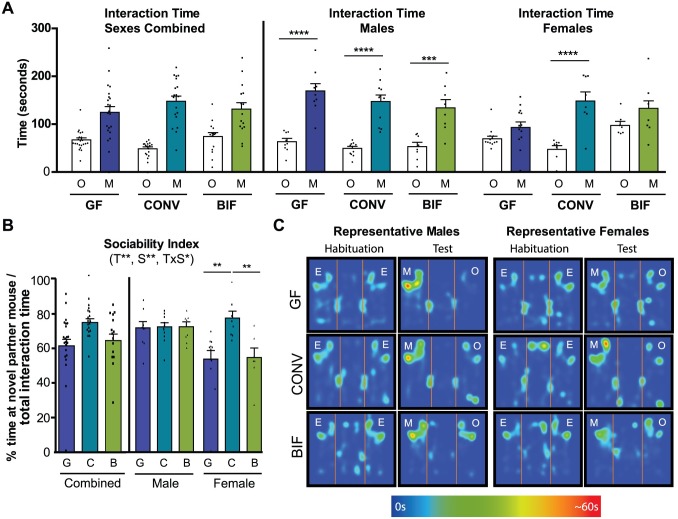
Fig 7. Sociability impairments of germ-free mice are rescued by colonization with a complex microbiota.
(A) Bars show total time (seconds) that the test subject spent interacting with either the novel object (O) or novel partner mouse (M) cups during the 10-minute test session. Males and females are presented separately (combined sexes not shown) (B) Bars represent Sociability Index (% time spent interacting with the mouse cup/total time interacting with cups) by each group of mice during the test session. (C) Representative heatmaps from male and female mice in each treatment group demonstrating time spent interacting with empty cups (E) during the habituation trial, and interaction time around the object (O) or mouse (M) cups during the test trial. The scale of the heatmap ranges between 0 seconds (blue) and 60 seconds (red). Significant treatment effects (T), sex effects (S), and interactions between treatment and sex (TxS) as determined by 2-way ANOVA are indicated under the title of each graph. Data are shown as sexes combined and sexes separated in the same graph for visualization purposes. Tests used to determine statistical significance notated in graphs are summarized in S1 Table. *p < 0.05, **p<0.01, ***p<0.001, ****p<0.0001. Results presented as mean ± SEM. GF = germ-free (n = 9m/13f), CONV = Conventionalized (n = 11m/8f), BIF = Bifidobacterium-colonized (n = 8m/9f).

