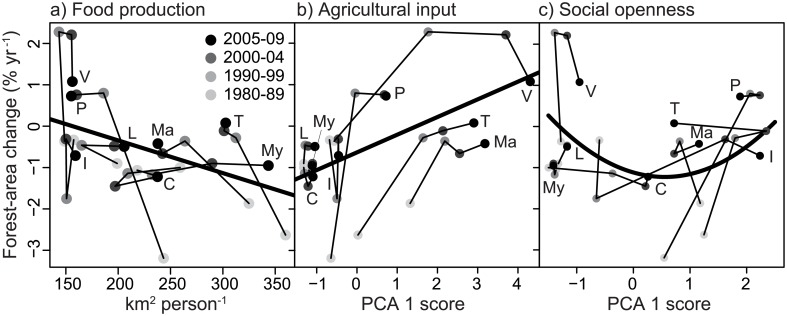
Fig 3. Relationship between rates of forest-area change and per capita areas required for food production (a), the index of agricultural input (b) and social openness (c).
Regression lines (bold) are the best-fit multiple regression model from S4 Table. Each country (C, Cambodia; I, Indonesia; L, Laos; Ma, Malaysia; My, Myanmar; P, Philippines; T, Thailand; and V, Viet Nam) is connected by thin lines following the time periods.

