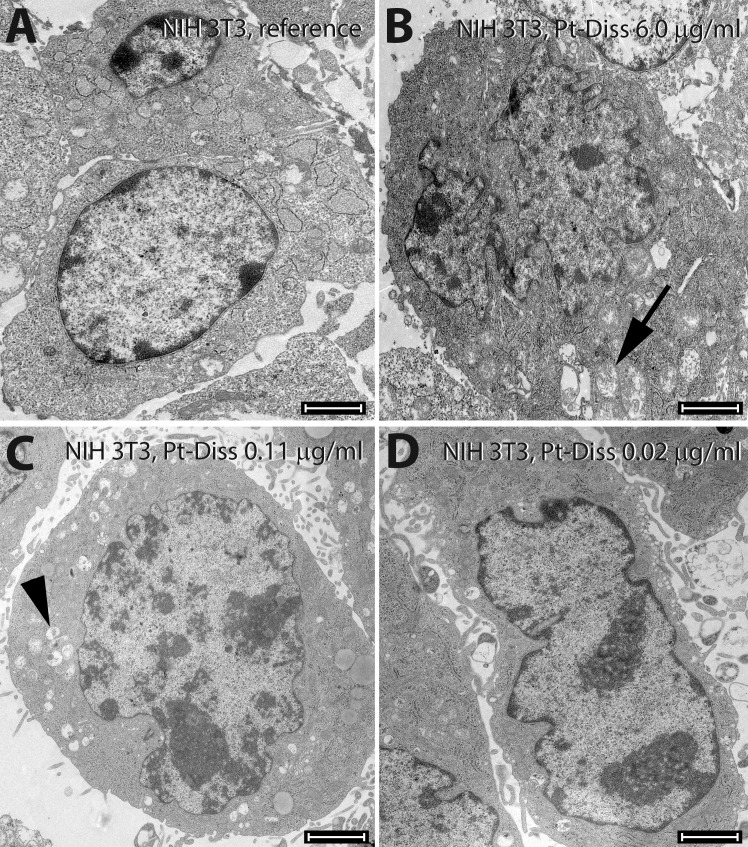
Fig 5. Ultrastructural morphology of NIH 3T3 cells following exposure to Pt-Diss.
After cultivation either without Pt as reference (A) or in culture medium containing 6.0 μg/ml (B), 0.11 μg/ml (C) or 0.02 μg/ml Pt (D) the ultrastructure of 3T3 fibroblasts was compared. They demonstrated mitochondrial swelling (arrow in B) only at the highest tested Pt concentration. At 0.11 μg/ml Pt the cells showed greater phagocytic activity (arrowhead in C). Lower amount of Pt in the culture medium induced no morphological changes in comparison with the control. Size of bars: 2 μm.

