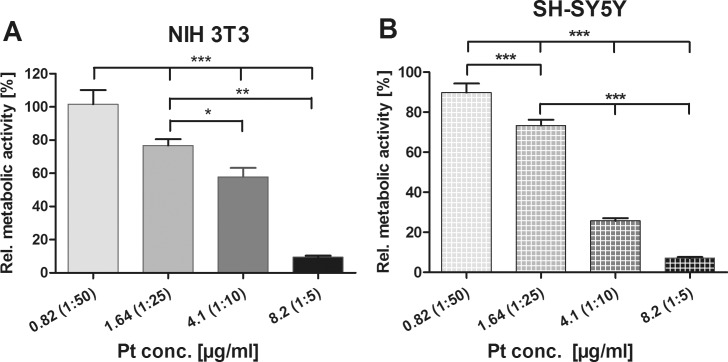
Fig 8. Determination of the effects of Pt-Diss with varying Pt-Diss concentrations in cell cultivation.
Metabolic activity of both NIH 3T3 (A) and SH-SY5Y cells (B) grown in culture medium supplied with 0.82 μg/ml– 8.2 μg/ml Pt-Diss concentration was determined by indirect reduction of WST-1 by mitochondrial dehydrogenases to a formazan dye. Optical densities (OD) were measured in 48 h and 6 d cultivation assays (NIH 3T3, n = 12–16; SH-SY5Y, n = 10). The resulting formazan dye intensities were related to those obtained from the reference and calculated as a percentage [%]. Each data point is presented as mean and SEM. ANOVA with Newman-Keuls multiple comparison test was performed for statistical assessment (***p ≤ 0.001, **p ≤ 0.01, *p ≤ 0.05).

