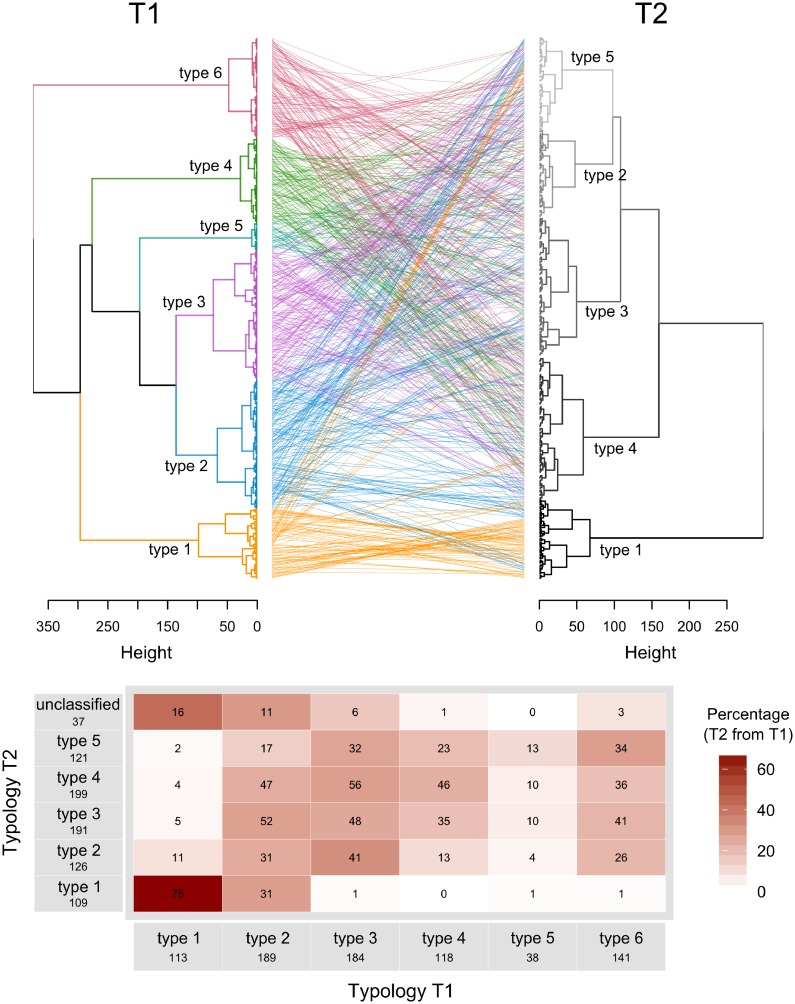
Fig 5. (a) Comparison of the two dendrograms from the resource-based typology (T1) and the crop-based typology (T2), and (b) cross-tabulation of numbers of farms of T1 allocated to different types of T2; the intensity of the red colouring indicates the percentage of overlap.
The ‘unclassified’ farms are farms that were included in T1 but were detected as outliers for T2. Fig 6a illustrates the overlapping between T1 and T2, comparing the individual position each farm in the two dendrogram of the two typologies, while Fig 6b quantifies the percentage of overlap between the two typologies.

