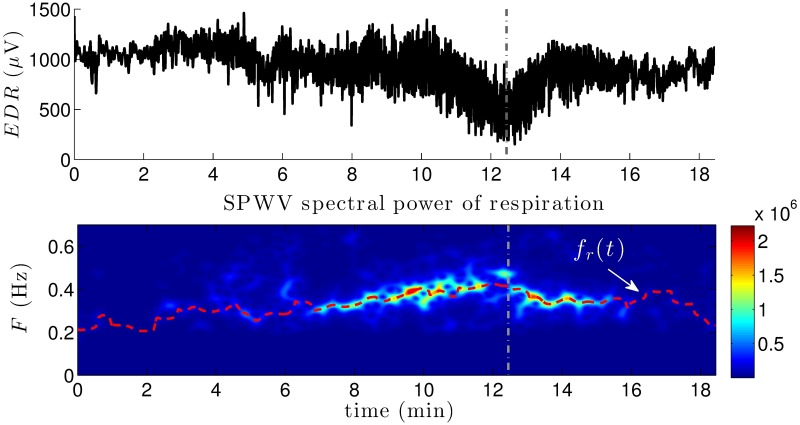
Fig 7. Representative example of respiration information.
The upper panel represents an example of EDR series, calculated from the R-wave peak amplitudes of a specific patient. The SPWVD spectral power associated is displayed in the second panel, along with the instantaneous respiratory frequency fr(t) estimated from a corrected version of the frequencies presenting the maximum spectral powers at each time instant (dashed red line). Vertical dashed lines indicate peak effort before recovery.

