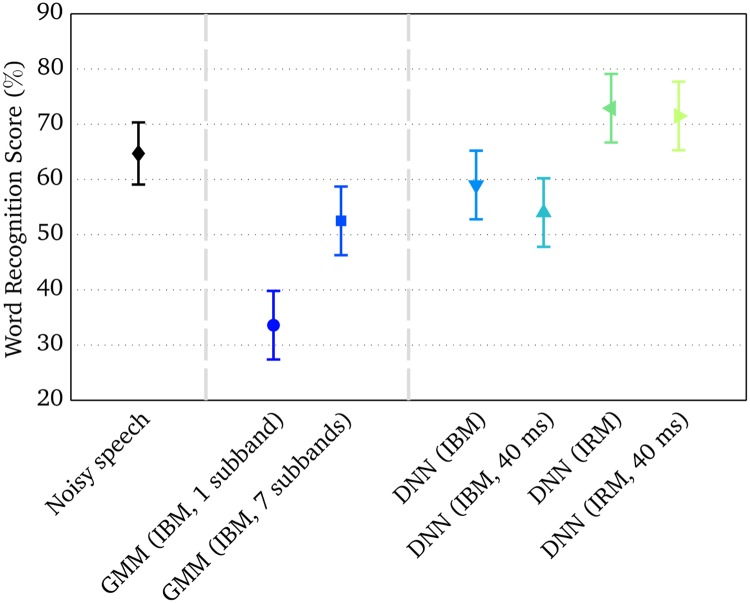
Fig 2. Measured WRSs in normal-hearing listeners at −5 dB SNR in the ICRA7 noise.
Unprocessed noisy speech served as a baseline condition. For the baseline (diamonds), sample means across subjects and 95% Student’s t-based confidence intervals of the mean were computed. For the system configurations, the least-squares means and 95% confidence limits of the least-squares means predictions derived from the linear mixed effect model were plotted.

