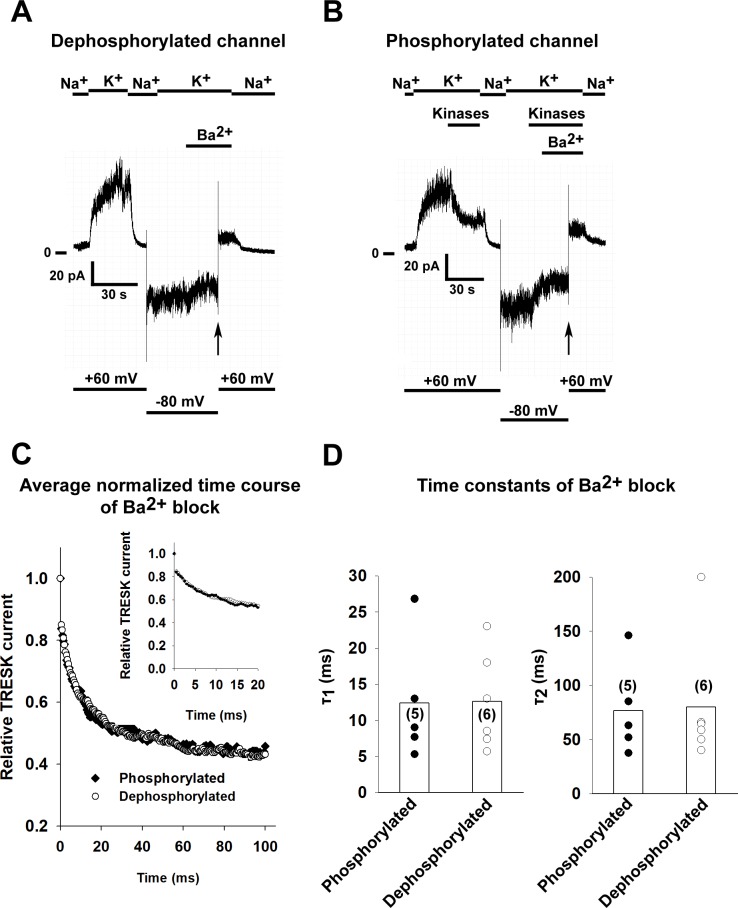
Fig 4. The phosphorylation state of TRESK does not influence the kinetics of Ba2+ block.
Mouse TRESK channels were expressed in HEK293T cells. Experiments were done on excised inside-out patches. TRESK currents were measured at +60 mV by switching the K+-free bath solution to a high K+ solution (solution changes are marked with bars above the graphs). Barium (1 mM) was applied at a holding potential of -80 mV and block was initiated by depolarizing the membrane to +60 mV. TRESK channels were either dephosphorylated by application of 0.5 μM ionomycin to the bath solution before recording or phosphorylated by application of purified MARK2 (16 μg/ml), 30 U/ml PKA (1 mM cAMP and 1 mM DTT was added to ensure the enzymatic activity of PKA) and 2 mM ATP before the initiation of the Ba2+ block. A, Representative recording, TRESK channels were dephosphorylated before patch excision by application of 0.5 μM ionomycin to the bath solution. Barium (1 mM) was applied at a holding potential of -80 mV and block was initiated by depolarizing the membrane to +60 mV (see the vertical arrow, application of Ba2+ is marked by a bar above the recording and changes in the membrane potential are shown under the recording). B, Representative recording, TRESK channels were phosphorylated by perfusing the intracellular side of the patch with a bath solution containing both kinases (purified MARK2, PKA, 1 mM cAMP, 1 mM DTT and 2 mM ATP) as shown on the graph. Barium (1 mM) was applied at a holding potential of -80 mV and block was initiated by depolarizing the membrane to +60 mV (see the vertical arrow, application of Ba2+ is marked by a bar above the recording and changes in the membrane potential are shown under the recording). C, The kinetics of TRESK current inhibition by Ba2+ were determined for both the phosphorylated and dephosphorylated channel (n = 6 and 5 patches). The average normalized curves for both groups are plotted. The inset shows the onset of Ba2+ with a higher temporal resolution. D, The current recordings of the Ba2+ block recorded for both the phosphorylated and dephosphorylated groups were fitted with a double exponential equation. The time constants of the fitted equations are plotted as a scatter plot. The average values are plotted as columns. The difference between the groups was not statistically significant (Student’s t test).

