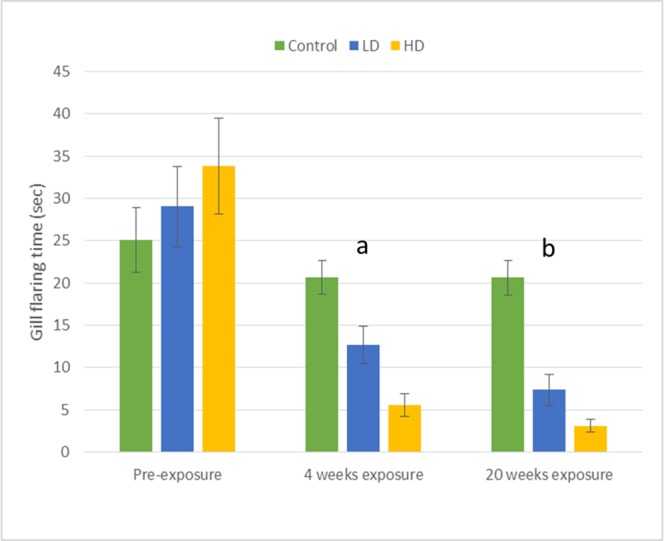
Fig 2. Means (±SE) for behaviors directed toward the male dummy stimulus.

The amount of time (sec) males in the low-dose (LD; 40 μg/L metformin), high-dose (HD; 80 μg/L metformin), and the control groups (C; no metformin exposure) spent gill flaring in each of three sequences of identical behavioral assays (pre-exposure, 4 weeks exposure, and 20 weeks exposure). Letter designations (a and b) correspond with significant p-values presented in Table 1 and indicate significant differences among the low-dose, high-dose, and control group means within a given time period of testing (e.g. comparing the HD vs LD vs C group responses after four weeks exposure) (See Table 1 for statistical results).
