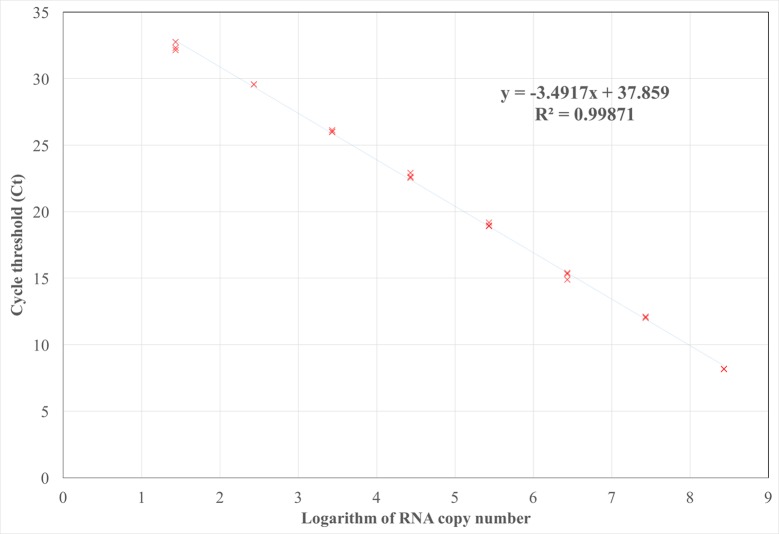
Fig 2. Absolute GPGV quantitation standard curve.
Cycle threshold (Ct) values obtained for three replicates of ten-fold serial dilutions of GPGV control transcripts are plotted. The mathematical equation of the standard curve used to quantify the real-time RT-PCR assays and the coefficient of correlation (R2) are indicated.

