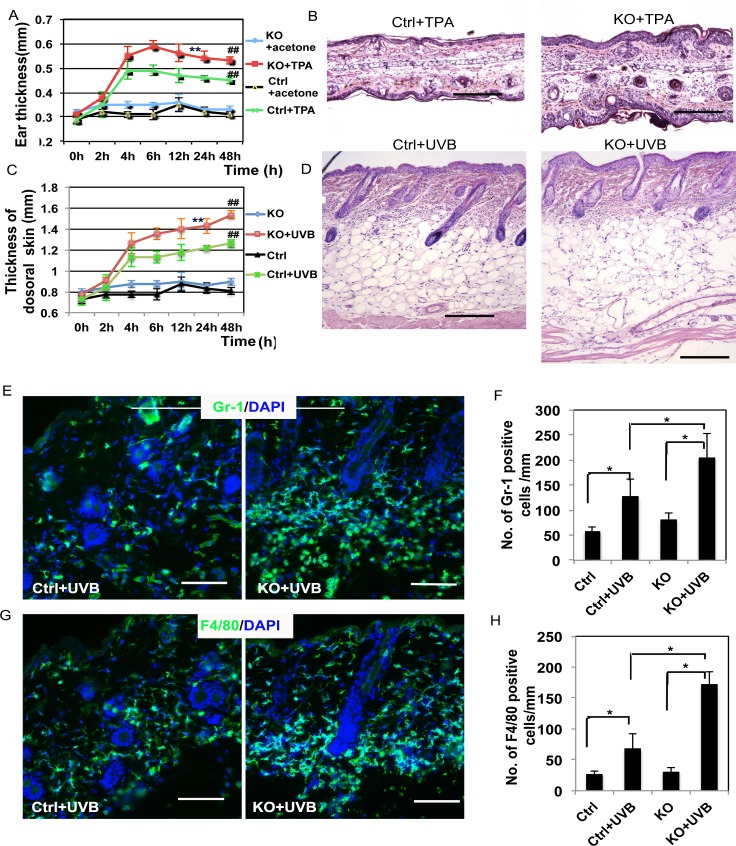
Fig 1. Deletion of CnB1 in keratinocytes enhances the skin acute inflammatory response to TPA treatment and to UVB exposure.
A. Ear thickness was measured at different time points as indicated. ## p<0.01 when comparing the TPA-treated group with the untreated group, ** p<0.01 when comparing the CnB1-/- (KO) group (KO+TPA) with the control CnB1+/+ group (Ctrl+TPA); B. Histological analysis of ears of Ctrl and KO mice at 48 hr after TPA treatment; C. Thickness of dorsal skin collected at the indicated time points was measured using a microscope. ## p<0.01 when comparing the UVB-exposed group with the untreated group, ** p<0.01 when comparing the KO group (KO+UVB) with the control group (Ctrl+UVB); D. Histological analysis of dorsal skins of Ctrl and KO mice at 48 hr after exposure to UVB; E-H. Sections from C and D were analyzed for infiltration of inflammatory cells by IF analysis of Gr-1 (E, green) and F4/80 (G, green), DAPI is used as a counter-stain for nuclei. The corresponding quantification analysis of E and G is shown in F (Gr-1) and H (F4/80). * p<0.05 when comparing the data indicated with the brackets. Bars = 500 μm for B, D; 100 μm for E, G. Student’s t test analysis was used for all quantification data to compare two groups as indicated, n = 3, Standard error bars are provided in A, C, F and H.

