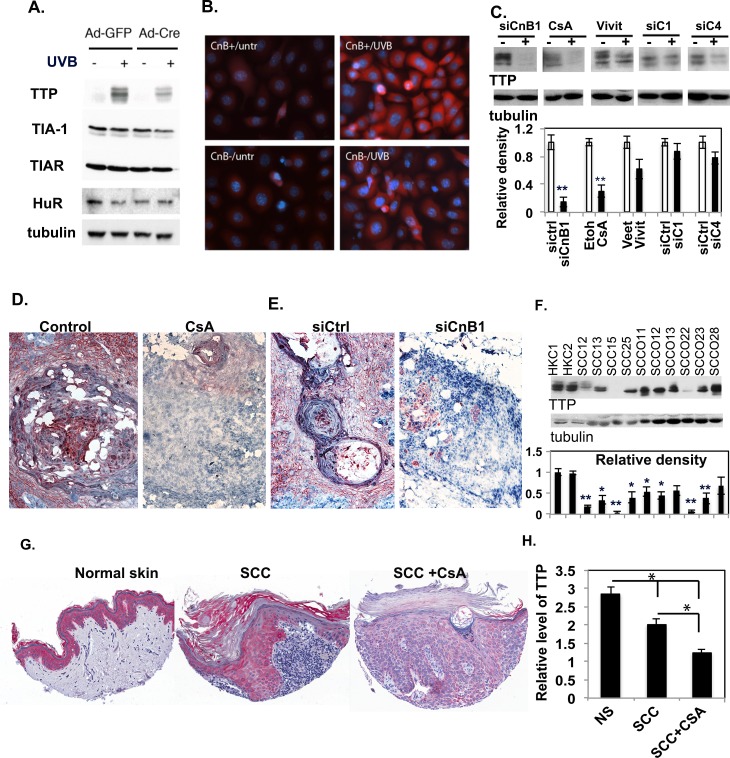
Fig 3. TTP is down-modulated in keratinocytes and in tumor tissues when calcineurin signaling is inhibited.
A. Ad-GFP- or Ad-Cre-infected CnB1flox/flox MKCs were irradiated with UVB (+) or were sham-irradiated (-). Four hr after irradiation, the cells were analyzed by immunoblot for TTP, TIA-1, TIAR and HuR proteins, and tubulin as a loading control. B. Ad-GFP (CnB+) and Ad-Cre infected (CnB-) CnB1flox/flox MKCs were sham-irradiated (untr) or were UVB-treated (UVB); after 4 hr they were stained with an anti-TTP antibody (red) and DAPI (blue) for nuclei. C. HKCs were either transfected with siRNA of CnB1 (siCnB1), NFATC1 (siC1), siNFATc4 (siC4) or a control scramble siRNA, or were treated with Vivit (Veet as control) or with CsA (DMSO as a control). After 72 hr, cells were lysed and immunoblotted for TTP, with tubulin as a loading control. The quantification of band density is shown in the lower panel. ** indicates p<0.001. D,E. IHC analysis of TTP in tumor sections from S2A Fig; F. Immunoblot analysis of TTP from 10 different SCC lines and two primary HKC lines; tubulin as a loading control. The full-blot image is shown in S5 Fig. Quantification of band densities is shown in the lower panel. *: p<0.05, **p<0.01 when compared to primary HKCs. n = 3. G-H. Tissue microarrays (TMAs) of cutaneous SCCs from patients with or without CsA treatment versus the normal skin (NS) from general untreated population were analysed for TTP expression by immunohistochemistry. The quantification of TTP is shown in H, * indicates p<0.05 when compared with each other as indicated.

