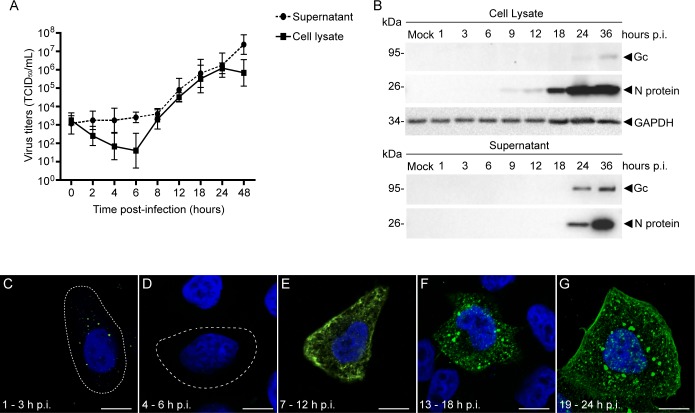
Fig 1. OROV replication cycle.
HeLa cells infected with OROV were analyzed during the virus cycle. (A) Virus titers were determined by TCID50 assay in Vero cells. Data are the mean ± SD of three independent experiments and are displayed as TCID50/mL. (B) Detection of OROV proteins in cell lysate and supernatant at different times p.i. by immunoblotting. Primary antibodies to OROV proteins and GAPDH (loading control) were used and the molecular weight (in kDa) is indicated on the left. A representative immunoblot from three independent experiments is shown. (C-G) Subcellular distribution of OROV proteins (green), monitored by immunofluorescence and confocal microscopy analysis. The images shown are representative of the period p.i. indicated. Cell outlines are indicated by dashed lines. Nuclei were stained with DAPI (blue). Bars = 10 μm.

