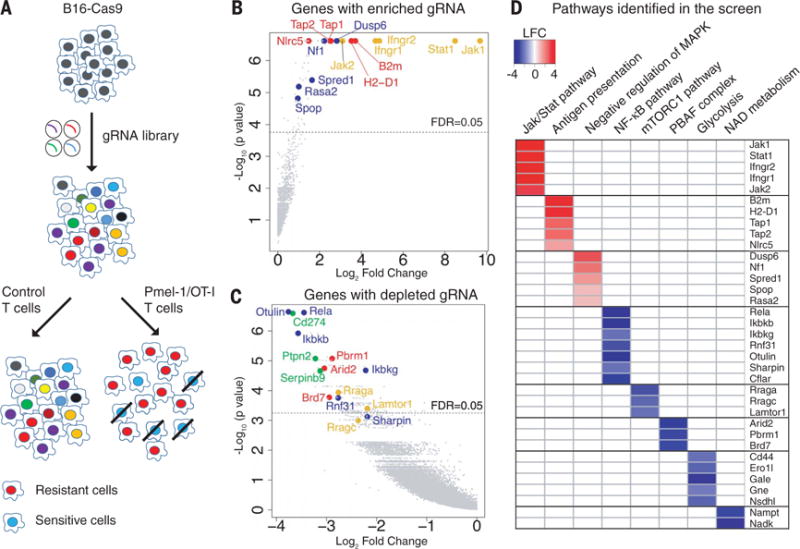
Fig. 1. Systematic discovery of genes and pathways regulating sensitivity and resistance of tumor cells to Tcell–mediated killing.

(A) Screening strategy. Cas9-expressing B16F10 cells were transduced with a genome-scale gRNA library (four gRNAs/gene). Edited B16F10 cells were cocultured with activated cytotoxic T cells followed by Illumina sequencing of gRNA representation. Specific selection was performed with Pmel-1 T cells (specific for gp100 melanoma antigen) or OT-I T cells (specific for Ova peptide). Control selection was performed with T cells of irrelevant specificity. (B) Top genes for enriched gRNAs from Pmel-1 screen. Candidate genes were plotted based on mean log2 fold change of gRNA counts compared to control selection and P values computed by MaGeCK (Model-based Analysis of Genome-wide CRISPR-Cas9 Knockout). Dashed line indicates a FDR (false discovery rate) of 0.05. Annotated genes represent MHC class I (red), interferon (yellow), and Ras/MAPK (blue) pathways. (C) Top genes for depleted gRNAs from Pmel-1 screen. Genes related to the PBAF form of SWI/SNF complex (red), NF-κB pathway (blue), mTORC1 pathway (yellow), and known negative immune regulators (green) were annotated. (D) Selected pathways and corresponding genes identified in the Pmel-1 screen. Color scale represents log2 fold change of average gRNA representation.
