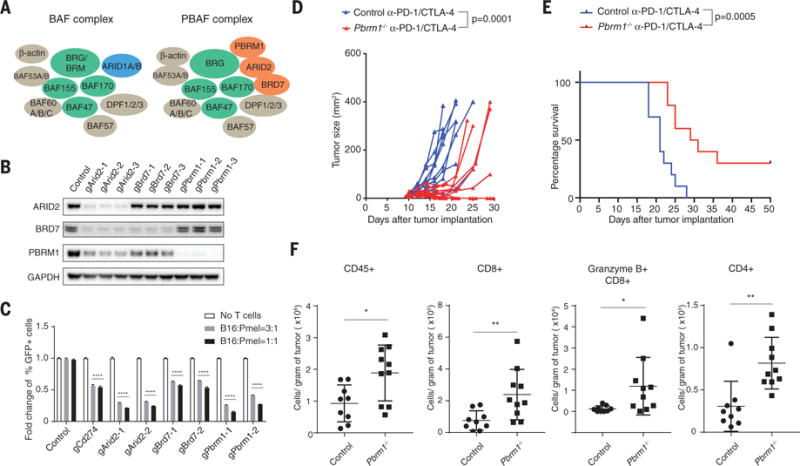
Fig. 3. Inactivation of PBAF complex sensitizes tumor cells to T cell–mediated killing and synergizes with checkpoint blockade therapy.

(A) Cartoon illustrating the composition of BAF and PBAF versions of SWI/SNF complex. (B) Western blot showing protein abundance of ARID2, BRD7, PBRM1, and GAPDH in control and indicated knockout cell lines. (C) Green fluorescent protein (GFP)–positive Arid2-, Pbrm1-, or Brd7-deficient B16F10 cells were mixed with GFP-negative control B16F10 cells at approximately 1:1 ratio. Tumor cells were cocultured with Pmel-1 Tcells at indicated effector-to-target ratios for 3 days in triplicates; the fold change of the percentage of GFP-positive tumor cells was determined by fluorescence-activated cell sorting. Two-way analysis of variance (ANOVA) was used to determine statistical significance (****P < 0.0001). Values represent mean ± SD. (D) Mice bearing control (n = 10) or Pbrm1-deficient B16F10 tumors (n = 10) were treated with anti–PD-1 (α-PD-1, 200 μg/mouse) plus anti–CTLA-4 (α-CTLA-4, 100 μg/mouse), and tumor size was measured. Two-way ANOVA was used to determine statistical significance for time points when all mice were viable for tumor measurement. (E) Survival of mice inoculated with control (n = 10) or Pbrm1-deficient B16F10 cells (n = 10) and treated with α-PD-1 plus α-CTLA-4. Log-rank (Mantel-Cox) test was used to determine statistical significance. (F) Flow cytometric analysis of immune cell infiltration in Pbrm1-deficient and control B16F10 tumors. The number of CD45+, CD4+, CD8+, and Granzyme B+ CD8+ T cells was determined per gram of tumor. Mann-Whitney test was used to determine significance (*P < 0.05, **P < 0.01). Values represent mean ± SD. Data in (C) to (F) are representative of two independent experiments.
