
Fig. 4. Enhanced responsiveness to IFN-γ stimulation by Arid2- and Pbrm1-deficient tumor cells.
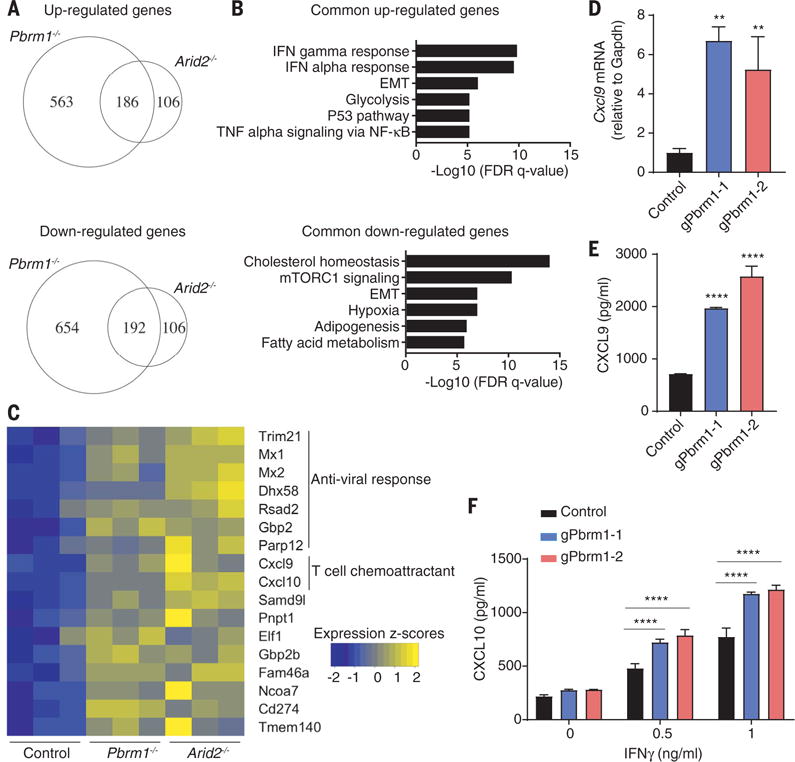
(A to C) RNA-seq analysis of Arid2- or Pbrm1-deficient cells and control B16F10 cells treated with IFN-γ (10 ng/ml) for 24 hours. (A) Venn diagram showing differentially regulated mRNAs in the presence of IFN-γ. (B) Hallmark gene sets enriched for commonly up- or downregulated mRNAs in both Arid2- and Pbrm1-deficient cells compared to control B16F10 cells in the presence of IFN-γ treatment [as shown in (A)]. (C) Heat map showing expression value (z-score based on cufflink count) of interferon-responsive genes in control, Arid2-, and Pbrm1-deficient B16F10 cells following IFN-γ treatment. (D and E) Cxcl9 mRNA level (D) and Cxcl9 protein secretion (E) comparing Pbrm1-deficient and control B16F10 tumor cells stimulated with IFN-γ (10 ng/ml) for 24 hours. Values represent mean ± SD. (F) Cxcl10 secretion by Pbrm1-deficient and control B16F10 tumor cells stimulated with IFN-γ (0, 0.5, and 1 ng/ml) for 24 hours. Values represent mean ± SD. One-way ANOVA (D and E) and two-way ANOVA (F) were used to determine significance. **P < 0.01, ****P < 0.0001. Data in (D) and (F) are representative of two independent experiments.