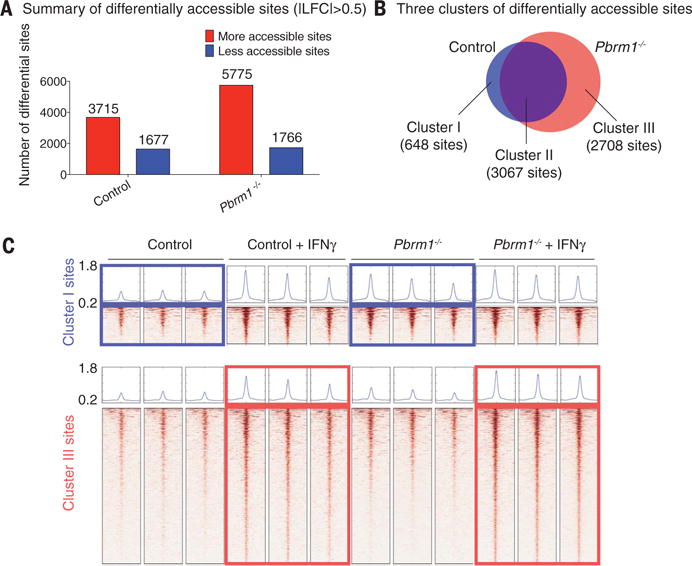
Fig. 5. Enhanced chromatin accessibility for IFN-γ–responsive genes in Pbrm1-deficient tumor cells.

ATAC-seq was performed on Pbrm1-deficient and control B16F10 cells with or without IFN-γ stimulation (10 ng/ml) for 24 hours. (A) Genome-wide analysis of differentially accessible chromatin sites (|log2 fold change| > 0.5) following IFN-γ stimulation in control versus Pbrm1-deficient B16F10 tumor cells. (B) Venn diagram illustrating accessible sites gained following IFN-γ treatment in control (blue) and Pbrm1-deficient (red) cells. (C) Chromatin accessibility heat maps for all sites in clusters I (top panel) and III (bottom panel). Aggregated reads within 2 kb of center of differentially accessible regions are shown above heat maps.
