. 2018 Apr 16;7:e29988. doi: 10.7554/eLife.29988

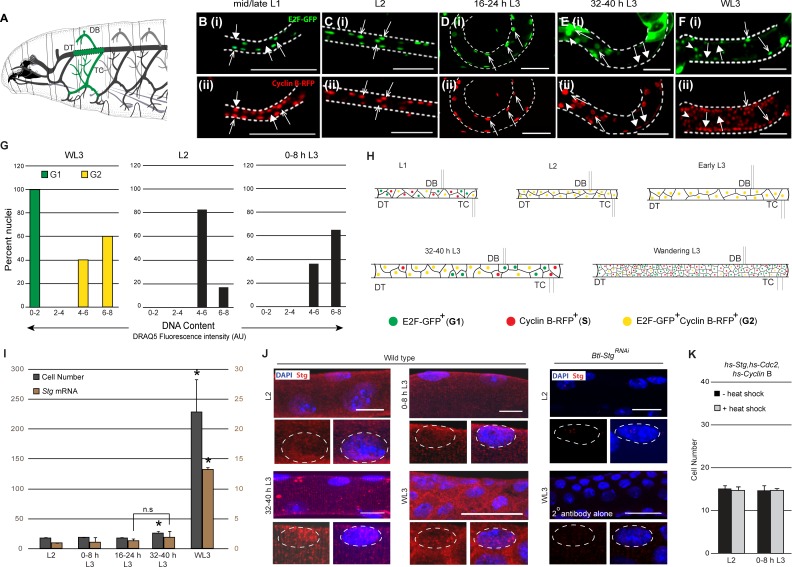
Figure 1. Tracheal progenitors arrested in G2 express Cdc25/String.

(A) Diagram of a third instar larva (L3) showing the tracheal branches in the second thoracic metamere, Tr2 (green). Dashed lines indicate the Tr2 Dorsal Trunk (DT) segment. (B–F) Expression of FUCCI reporters E2F1-GFP (green, arrowheads B(i)-F(i)) and CyclinB-RFP (red, filled arrows (B(ii)-F(ii)) at different larval stages. Double-positive cells are indicated with open arrows. Scale bar = 50 µm. (G) Comparison of the DNA content of mitotically active cells in G1 and G2 (left panel, cells from Tr2 DT at the wandering L3 stage staged using FUCCI) and G2-paused cells in Tr2 DT at L2 (middle panel) and 0–8 h L3 (right panel). DNA content was estimated using DRAQ5 fluorescence intensity (see methods). Plotted in the histogram are DNA content measurements from WL3 G1 (n = 13 nuclei) WL3 G2 (yellow, n = 15 nuclei), L2 (n = 23 nuclei) and 0–8 h L3 (n = 14 nuclei). (H) Cartoon showing the cell cycle program of cells in Tr2 DT at different larval stages. (I) Numbers of cells (grey bars) and Stg mRNA levels (quantitative PCR (brown bars)) in Tr2 DT at different larval stages. Graph shows cell numbers (mean ± standard deviation, n ≥5 tracheae per timepoint, grey axes) and fold change in mRNA levels with respect to L2 (mean ± standard deviation, brown axes). (J) Stg immunostaining (red) in Tr2 DT in wild type at different stages. Also shown are Tr2 DT from Btl-StgRNAi and from wild type larvae stained with the secondary antibody alone (far right panels). The distribution of Stg in the nucleus and cytoplasm can be seen in the higher magnification views of single nuclei below each panel. (K) Effect of heat shock-dependent co-expression of Stg, Cdc2 and CyclinB on cell number in Tr2 DT (mean ± standard deviation, n ≥ 5 tracheae per timepoint). DT = Dorsal Trunk,DB = Dorsal Branch, TC = Transverse Connective.Scale bar = 10 µm. Student's paired t-test: *p<0.05. n.s = not significant.

Figure 1—source data 1. Figure 1G: Background intensity corrected values for DRAQ5 intensities at L2, 0–8 h L3 and WL3 Figure 1I: Numerical data for number of cells in Tr2 DT of wild type larvae at different stages.
DOI: 10.7554/eLife.29988.006

Figure 1.

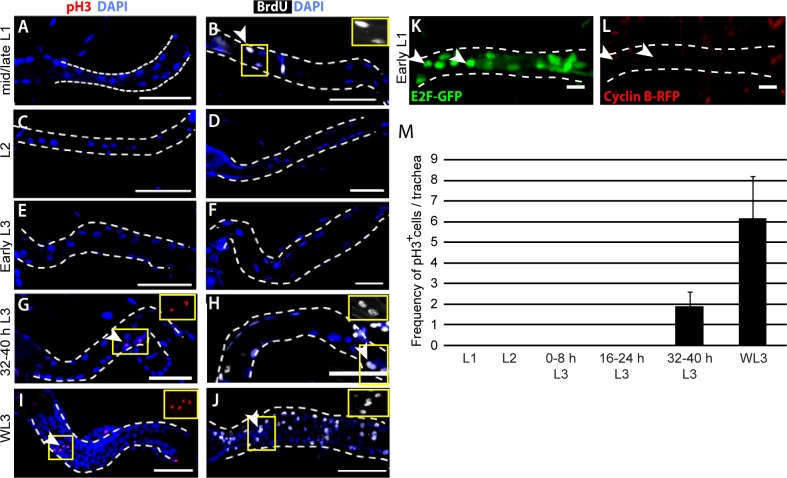
Figure 1—figure supplement 1. Tr2 tracheoblasts enter S phase in L1 and enter M phase mid L3, after a period of ~48–56 h.

Figure 1—figure supplement 1.

(A–J) Characterization of the cell cycle phasing of cells in Tr2 DT at different larval stages. (A,C,E,G,I) Phospho-Histone H3 immunostaining at different larval stages indicated (pH3, red, arrowheads; DAPI, blue). (B,D,F,H,J) BrdU immunostaining at different larval stages indicated (BrdU, white arrowheads; DAPI, blue). Scale bar = 50 µm. (K–L) Expression of FUCCI reporters E2F1-GFP (green, arrowheads) and CyclinB-RFP (red) in Tr2 DT in early L1. (M) Mitotic indices of Tr2 DT in wild type larvae at different larval stages. Graph shows the frequency of pH3+ nuclei in Tr2 DT at indicated stages (mean ± standard deviation, n = 6 tracheae per timepoint). Scale bar = 10 µm.
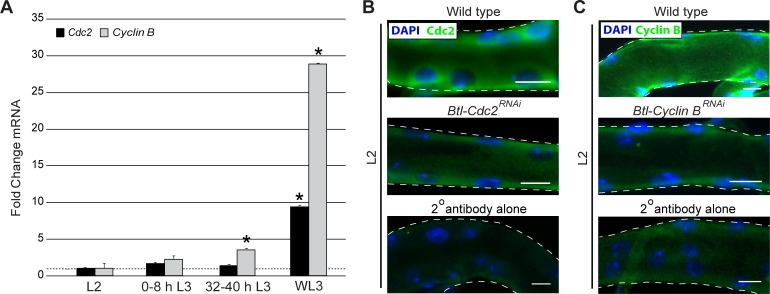
Figure 1—figure supplement 2. Tr2 tracheoblasts arrested in G2 express Cdc2/Cdk1 and Cyclin B.

Figure 1—figure supplement 2.

(A) Quantitative PCR analysis of Cdc2/Cdk1 and CycB mRNA levels in micro-dissected Tr2 DT fragments at different larval stages. Graph shows fold change in mRNA levels (mean ± standard deviation) with respect to L2 (indicated by dashed line). (B) Cdc2 immunostaining (green) in Tr2 DT in wild type and Cdc2RNAi expressing larvae in L2. Also shown is Tr2 DT in L2 stained with the secondary antibody alone (bottom panel). (C) CyclinB immunostaining (green) in Tr2 DT in wild type and CyclinBRNAi expressing larvae at L2. Also shown is Tr2 DT in L2 stained with the secondary antibody alone (bottom panel). The staining for Cdc2 and CycB representative of 2 independent immunohistochemical experiments in which at least 6 tracheae from each of the conditions shown were stained and imaged. In addition, we have also examined levels of Cdc2 and CycB in 6 tracheae each at 0–8 h L3, 32–40 h L3 and Wandering L3 in two independent experiments (data has been shown). Scale bar = 10 µm. Student's paired t-test: *p<0.05.