. 2018 May 15;7:e33953. doi: 10.7554/eLife.33953

Figure 2. Cgr2 is sufficient for digoxin reduction and requires FAD and [4Fe-4S] cluster(s) for activity.

(A) Whole cell assays using R. erythropolis expressing Cgr1 and Cgr2 constructs demonstrated that Cgr2 is sufficient for reducing digoxin. Data represents the mean ± SEM (n = 3 biological replicates). Asterisks indicate statistical significance of each variant as compared to empty vector by Student’s t test (**p<0.01, ***p<0.001) (Figure 2—source data 1). (B) Annotation and amino acid numbering of Cgr2, including the predicted Tat secretion signal and three conserved flavin-binding motifs from the glutathione reductase family (X = any amino acid; h = hydrophobic residue). (C) In vitro activity of Cgr2 for digoxin reduction using reduced methyl viologen as an electron donor, analyzed by liquid chromatography-tandem mass spectrometry (LC-MS/MS). [Fe-S] cluster reconstitution, FAD, and anaerobic conditions are required for Cgr2 activity. Data represents the mean ± SEM (n = 3 independent experiments) (Figure 2—source data 2). FAD = flavin adenine dinucleotide; FMN = flavin mononucleotide. (D) Ultraviolet-visible (UV-Vis) absorption spectra of Cgr2 revealed an oxygen-sensitive peak centered around 400 nm that increased upon [Fe-S] cluster reconstitution, supporting the presence of [4Fe-4S] clusters in Cgr2. (E) Electron paramagnetic resonance (EPR) spectra of sodium dithionite-reduced Cgr2 reconstituted with iron ammonium sulfate hexahydrate ((NH4)2Fe(SO4)2·6H20) and sodium sulfide (Na2S·9H20). G-values and decreased EPR signal intensity at higher temperatures (10 – 40 K) indicated the presence of low potential [4Fe-4S]1+ clusters. Experimental conditions were microwave frequency 9.38 GHz, microwave power 0.2 mW, modulation amplitude 0.6 mT, and receiver gain 40 dB.

Figure 2—source data 1. Digoxin metabolism by Rerythropolis overexpressing Cgr proteins.
DOI: 10.7554/eLife.33953.011
Figure 2—source data 2. Digoxin metabolism by Cgr2 in vitro.
DOI: 10.7554/eLife.33953.012
Figure 2—source data 4. Digoxin metabolism by Rerythropolis overexpressing Cgr2 cysteine to alanine point mutants.
DOI: 10.7554/eLife.33953.014
Figure 2—source data 5. Digoxin metabolism by Cgr2 cysteine to alanine point mutants in vitro.
DOI: 10.7554/eLife.33953.015

Figure 2.

Figure 2—figure supplement 1. [Fe-S] cluster(s) affect Cgr2 stability and oligomerization.

Figure 2—figure supplement 1.

(A) SDS-PAGE analysis of heterologously expressed Cgr2(–48aa)-NHis6 constructs (expected mass = 55 kDa) purified on HisPur Ni-NTA resin. Heat-generating lysis methods (e.g. sonication) led to substantial protein degradation as compared to cell disruption. (B) Analytical fast protein liquid chromatography (FPLC) performed under aerobic and anaerobic conditions. Colored bars highlight molecular weights corresponding to dimeric (blue) or monomeric (pink) Cgr2. (C) Thermal melt curves displaying relative fluorescence of Sypro Orange bound to purified and (D) reconstituted Cgr2 in various pH buffers. Protein melting temperature (Tm) of purified protein was < 37°C before reconstitution and increased to 40 – 50°C after reconstitution.
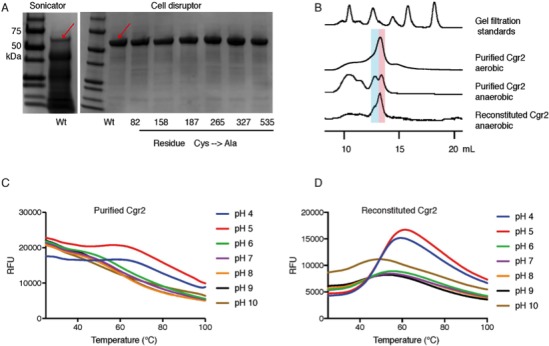
Figure 2—figure supplement 2. Cgr2 activity, but not EPR-active [4Fe-4S] clusters, increase with higher Fe and S equivalents.

Figure 2—figure supplement 2.

(A) Ultraviolet-visible (UV-Vis) spectra of reconstituted Cgr2 in the absence or presence of reducing agent sodium dithionite (NaDT) revealed that the [Fe-S] clusters in Cgr2 are redox active. (B) Purified Cgr2 did not exhibit a detectable EPR signal. Upon reduction with NaDT, an EPR signal corresponding to [4Fe-4S]1+ clusters was detected in purified Cgr2. This signal was amplified in reconstituted Cgr2, showing incorporation of additional [4Fe-4S] cluster(s). Samples contained 200 µM protein, 0.2 mM sodium dithionite, and EPR measurements were conducted at 10 K. (C) EPR spectra of dithionite-treated Cgr2 samples that had been reconstituted with 0 (purified), 2, 4, or 8 equivalents of iron and sulfide for 5 hours or overnight (O/N). Samples contained 150 µM protein, 0.3 mM sodium dithionite, and measurements were conducted at 10 K. Number of EPR-active clusters per Cgr2 monomer under each reconstitution condition is shown in parentheses. Spin quantitation was determined against a 150 µM Cu2+-EDTA standard measured under non-saturating conditions. (D) In vitro reaction rates of Cgr2 reconstituted under different conditions revealed increasing activity with higher reconstitution equivalents. Data represents mean ± SEM (n = 3 independent experiments).
Figure 2—figure supplement 3. Identification of 6 cysteine residues important for Cgr2 activity.

Figure 2—figure supplement 3.

(A) Whole cell assays of R. erythropolis expressing individual cysteine to alanine point mutants and incubated with digoxin demonstrated that six cysteine residues are important for activity. Data represents mean ± SEM (n = 3 biological replicates). Asterisks indicate statistical significance of each variant compared to wild-type Cgr2 by Student’s t test (*p<0.05, **p<0.01) (Figure 2—source data 4). (B) Mass spectrometry analysis of in vitro assays (quenched at 15 min) containing reconstituted wild-type Cgr2 or single cysteine to alanine point mutants. Data represents mean ± SEM (n = 3 independent experiments). Asterisks indicate statistical significance of each variant compared to wild-type Cgr2 by Student’s t test (***p<0.001) (Figure 2—source data 5). (C) SDS-PAGE analysis of clarified lysate from R. erythropolis cells transformed with empty pTipQC vector or expressing cytoplasmic wild-type Cgr2 (wt) or individual cysteine to alanine point mutants (~55 kDa). All point mutants were soluble. (D) [4Fe-4S]1+ clusters were detected by EPR in all Cgr2 point mutants treated with sodium dithionite. Spin quantitation against a Cu2+-EDTA standard revealed similar levels of [4Fe-4S]1+ clusters per Cgr2 monomer for all variants. Number of clusters shown in parentheses. (E) Divalent metal cations (Fe2+, Mg2+, Mn2+) stimulated the activity of Cgr2 in vitro. Data represents mean ± SEM (n = 3 independent experiments). (F) Addition of Fe2+ stimulated the activity of three cysteine residues, potentially implicating C92, C265, and C535 in metal binding. Data represents mean ± SEM (n = 3 independent experiments).