
Fig. 3.
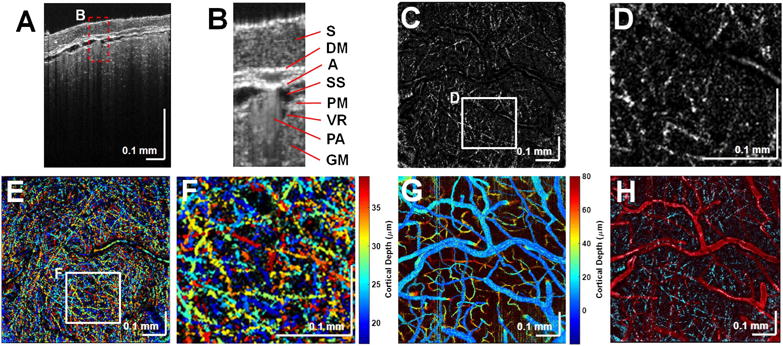
Structural cross-sectional imaging of (A) the mouse neocortex with (B) labeled meningeal layers. S, skull; DM, dura mater; A, arachnoid; SS, subarachnoid space; GM, gray matter; PM, pia mater; PA, pial artery; and VR, Virchow–Robin space (dark region next to PA). Myelin is shown in 6 μm thick en face MIPs (C) and (D). (E) Depth-encoded color display of myelinated axons and (F) zoomed-in version of the white box in (E). (G) Depth-encoded color display of the angiogram. (H) Overlay of the en face MIPs of the angiogram (red) and the myelinated axons (cyan).