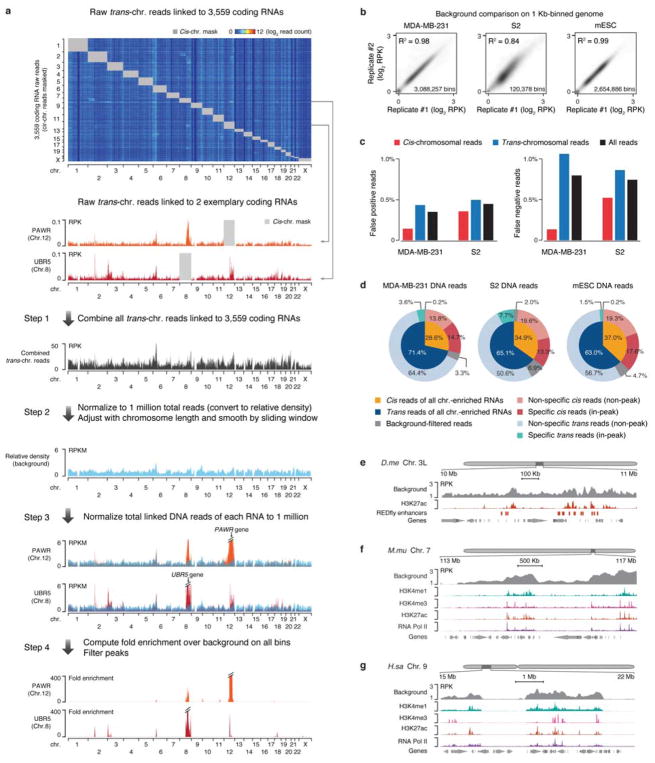
Extended Data Fig. 4. Construction of a background model for GRID-seq data analysis.
a, Steps in building the background with trans-chromosomal interacting mRNAs. GRID-seq detected raw DNA reads of trans-acting mRNAs (n=3,559) on chromatin were displayed on all chromosomes with their cis-acting signals masked by grey boxes. Two specific mRNAs on their trans locations were highlighted below the heatmap. Step 1: All trans-acting mRNAs were summed, and then in Step 2, normalized to 1 million total reads. Step 3: The GRID-seq signals of the two specific mRNAs were similarly normalized to 1 million across all chromosomes. Red signals above the general background were highlighted. Step 4: Specific interaction sites were displayed after background correction. b, Comparison of deduced background from replicate GRID-seq libraries constructed on human MDA-MB-231 cells, mESCs and Drosophila S2 cells. Each genome was 1 Kb binned for global comparison. RPK: reads per Kb. c, Comparison between the true background based on the human/Drosophila mixing experiment and the deduced background from mRNA trans-chromosomal reads in inferring specific RNA-chromatin interactions. The data illustrate <1% discrepancies in inferring cis, trans, or all reads in both MDA-MB-231 and S2 datasets. d, Quantification of cis/trans-chromosomal reads distribution before and after background correction. e,f,g, Background GRID-seq signals in open chromatin regions in human (e), mouse (f), and Drosophila (g) cells. Chromatin marks and Pol II binding were displayed on autoscale.

