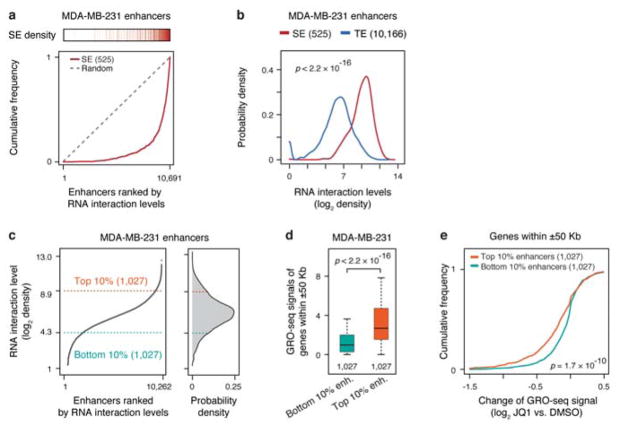
Extended Data Fig. 8. RNA interaction levels on super-enhancers and relative contribution of typical and super-enhancers to transcription.
a, Super-enhancers in relationship to RNA-chromatin interaction levels. Enhancers in MDA-MB-231 cells were ranked by RNA interaction levels. Each red bar on top represents a super-enhancer. Red curve: The accumulative curve of rank-ordered RNA-chromatin interactions; Grey dashed line: Random distribution. b, Density distribution of chromatin-enriched RNAs at super-enhancers (SE, red) and typical enhancers (TE, blue). c, Left: Rank-ordered RNA-chromatin interaction levels at all active enhancers. Right: The Top 10% and bottom 10% enhancers with the most and the least RNA interactions, respectively, selected for functional analysis. d, Gene transcription associated with top 10% enhancers (orange box) and bottom 10% enhancers (green box). e, Accumulation curves of transcription changes of genes associated with top 10% and bottom 10% enhancers in response to JQ1 treatment in MDA-MB-231 cells. Statistical significance of comparison is estimated by Student’s t-test in panel b, d and e.

