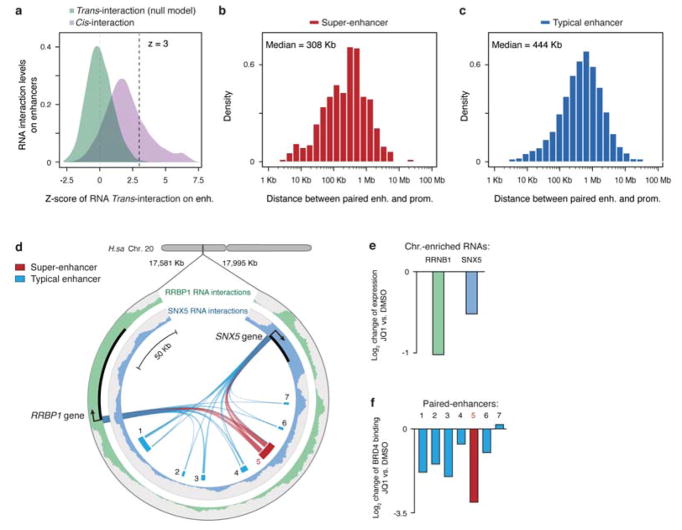
Extended Data Fig. 10. Inferred enhancer-promoter distance and examples.
a, Density distributions of cis- and trans-chromosomal RNA interaction levels on enhancers in MM.1S cells. x-axis: Z-scores of all trans-chromosomal RNA interactions (green). Z≥3 was used to identify significant RNA interactions on individual promoter and enhancer elements. b,c, Distribution of linear DNA distance between genes and RNA decorated super-enhancers (b) and typical enhancers (c). d, Circos plot, showing a representative case of two chromatin-enriched RNAs RRBP1 and SNX5 on nearby seven enhancers, one of which corresponds to a super-enhancer (red) in MM.1S cells. The RRBP1 RNA interaction profile is shown on the outer track (green) and the SNX5 RNA interaction profile on the inter track (blue). Ribbons connecting with enhancers illustrate inferred enhancer-promoter association. e, f, Upon JQ1 treatment, fold-changes in gene expression are shown in e and fold-changes in BRD4 binding on individual enhancers in f.

