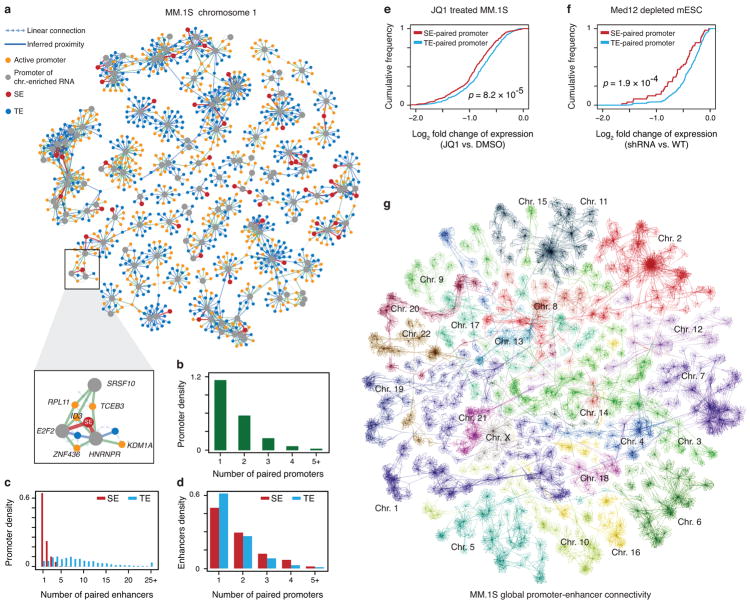
Fig. 6. Inferring promoter-promoter and promoter-enhancer connectivity by chromatin-enriched RNAs.
a, A representative subnetwork of RNA-chromatin interactions on Chr. 1 in MM.1S cells, exhibiting intra-chromosomal promoter-promoter and promoter-enhancer connectivity. b, The number of chromatin-enriched RNA genes paired with each active promoter. c, The number of chromatin-enriched RNA genes paired with typical (blue) or super- (red) enhancers. d, The number of enhancers paired by each chromatin-enriched RNA gene. e,f, Fold-changes in gene expression plotted in the accumulative fashion for the genes associated with only typical enhancers (blue) versus those also linked to super-enhancers (red) in response to JQ1 treatment in MM.1S cells (f) or Mediator depletion in mESCs (g). P-values in e and f were determined by Kolmogorov–Smirnov test. g, Self-organized map for visualization of the whole-genome network in MM.1S cells. Individual chromosome territories are highlighted.

