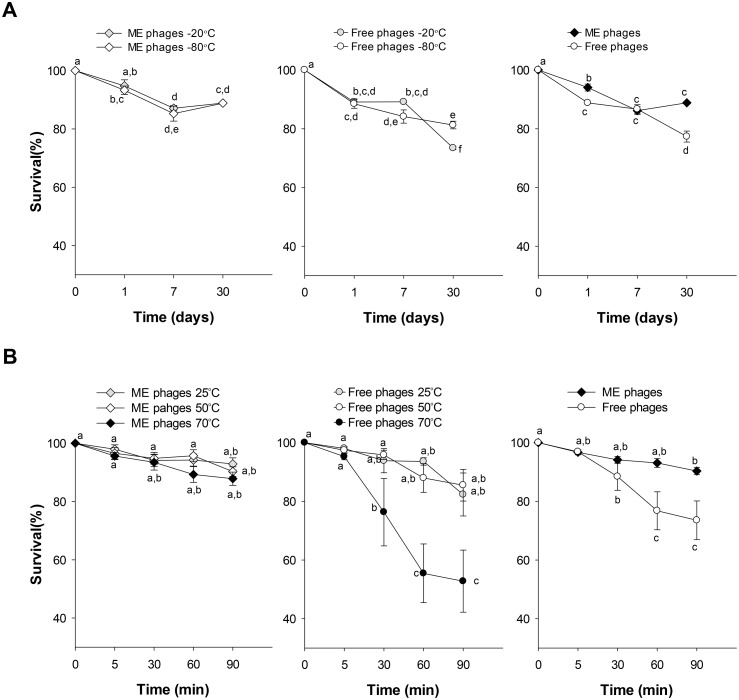
Fig 2. Stability of microencapsulated and free phages at different storage temperatures.
Microencapsulated (ME) and free phages were stored at low (A) and high (B) temperatures for different times. Data represents mean values ± SEM of three independent experiments. Right, interaction plot of phage survival means calculated for timepoint at each phage condition. Different letters represent significant differences between groups (P<0.02), whereas letters shared in common between or among the groups indicate no significant differences.

