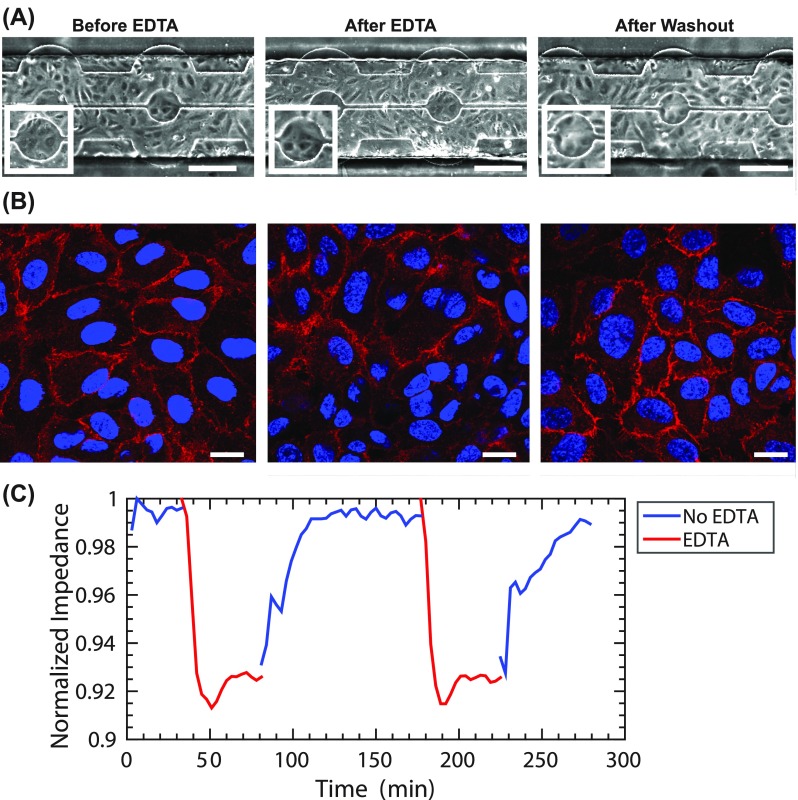
FIG. 4.
Impact of EDTA Treatment on the barrier: (a) Brightfield and (b) confocal microscopy of HUVECs treated before EDTA treatment, during 2 mM EDTA treatment, and after they are recovered with normal media, scale bar: 200 μm. HUVECs were also stained for VECAD (red) and DAPI (blue), scale bar: 20 μm. (c) A representative impedance reading along the culture period is shown during the treatment and recovery phases of HUVECs treated with 2 mM EDTA at 1 dyne/cm2.

