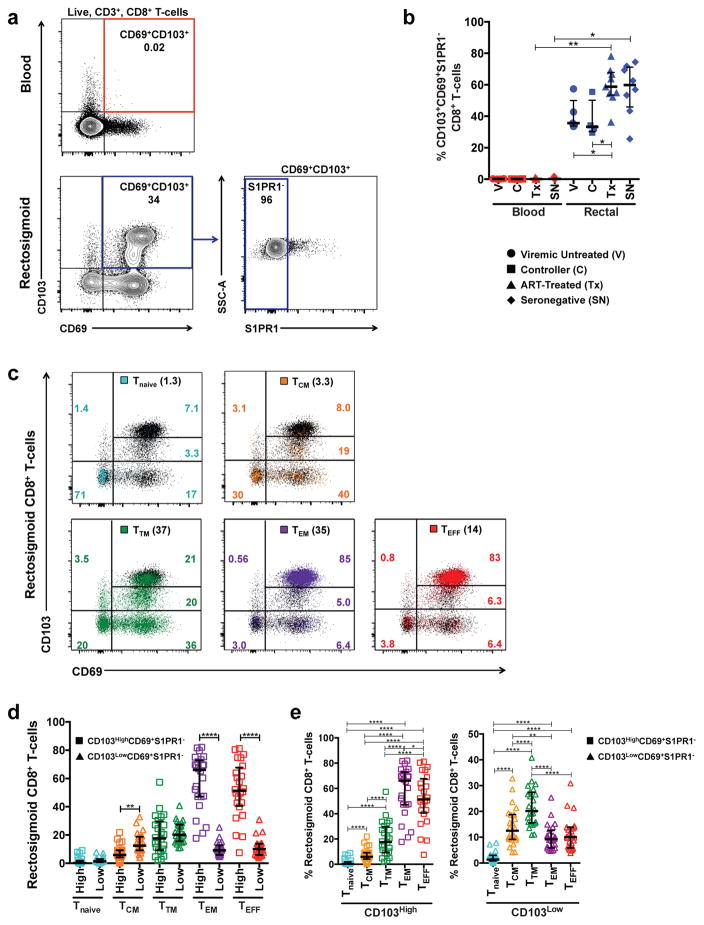
Figure 1.
Characterization and distribution of tissue-resident CD8+ T-cells in the rectosigmoid mucosa of chronically HIV-1-infected and seronegative participants. (a) Representative flow cytometry plot displaying surface staining of tissue-resident markers and gating strategy used to identify live, CD3+, tissue resident CD8+ T-cells as CD103+CD69+S1PR1− in blood (red) and rectosigmoid mucosa (blue). (b) Differences in the frequency of CD103+CD69+S1PR1− CD8+ T-cells between blood and rectosigmoid mucosa across HIV-1 disease status. (c) Representative flow cytometry plot demonstrating the difference in CD103 fluorescence intensity and CD69 expression in rectosigmoid naïve (Tnaive, aqua), central memory (TCM, orange), transitional memory (TTM, green), effector memory (TEM, purple), and effector (TEFF, red) CD8+ T-cells. Numbers in parentheses indicate the percentage of the memory subset in the total rectosigmoid CD8+ T-cell population; colored numbers indicate frequency of the memory subset in each quadrant. Memory/effector subsets were first identified by differential expression of CD45RO, CD27, and CCR7 as described in the text. (d) Comparison of the frequencies of rectosigmoid CD103High and CD103Low CD69+S1PR1− CD8+ T-cells within each memory subset, or (e) between memory subsets in a combined group of chronically HIV-1-infected and seronegative participants. Horizontal bars represent median, whiskers indicate interquartile ranges with the level of significance shown with asterisks as follows: * P <0.05, ** P <0.01, *** P <0.001, **** P <0.0001.

