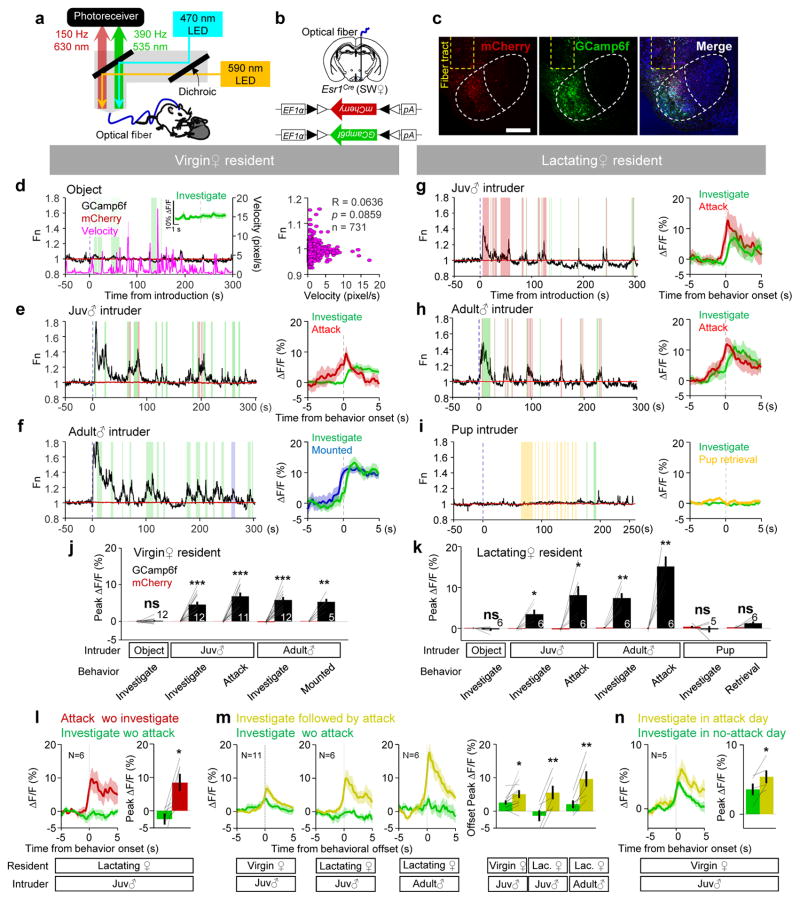
Figure 2. Responses of Esr1+ population in the female VMHvl during fighting and mating.
(a) Light paths of the fiber photometry recording setup. (b) Viral constructs and implantation scheme. (c) Representative images showing mCherry (red), GCaMP6f (green), Nissl (blue) and optical fiber tract (yellow dashed line). Scale bar: 300 μm. (d–i) (left): Representative normalized GCaMP6f (black) and mCherry (red) traces during interaction with (d) an object and (e–i) various social stimuli introduced into the home cage of the test female. Colored shades mark behavioral episodes. Green: investigation; Blue: mounted; Red: attack, Yellow: pup retrieval. (d) (right): The velocity of the recorded animal did not correlate with GCaMP6f signal. Pearson product-moment correlation. Inset in (d) and right panels in (e–i) showing representative PETHs of GCaMP6f signal aligned to the onset of various behaviors. (j–k) The peak ΔF/F of GCaMP6f (black) and mCherry (red) signals during various behaviors in virgin (j) and lactating (k) females. (l–n) Population PETHs (left) and the peak ΔF/F (right) of GCaMP6f signals aligned to the onset (l, n) or offset (m) of various behaviors. j, k, l, m and n: paired t-test. *p < 0.05, **p < 0.01, ***p < 0.01. Data are presented as means ± s.e.m.. [AU Query: OK?] See Supplementary Table 2 for detailed statistics. See also Supplementary Figure 3–5.

