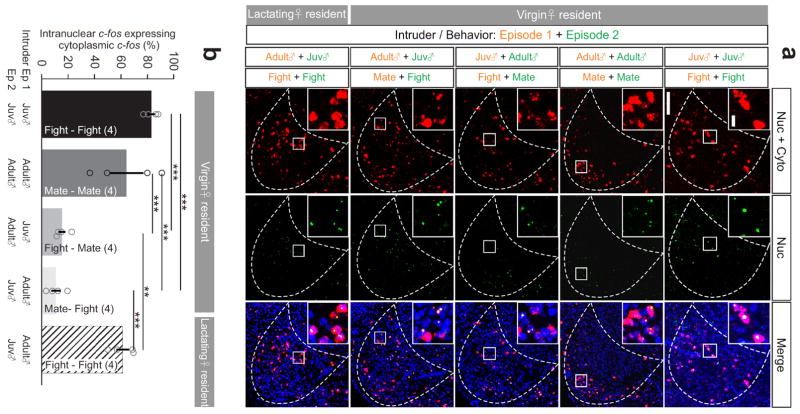
Figure 6. Topographical organization of fighting- and mating-related cells in the female VMHvl.
(a) Cytoplasmic + nuclear (red) and nuclear only (green) c-fos induced by two sequential behavioral episodes. Insets show the enlarged images of the boxed areas. Blue: Hoechst. Scale bars: 150 μm and 20 μm (insets). (b) Percentage of neurons expressing nuclear c-fos that also express cytoplasmic c-fos. One-way ANOVA followed by Tukey’s multiple comparisons. **p < 0.01, ***p < 0.001. Data are presented as means ± s.e.m.. [AU Query: OK?] See Supplementary Table 2 for detailed statistics. See also Supplementary Figure 12.

