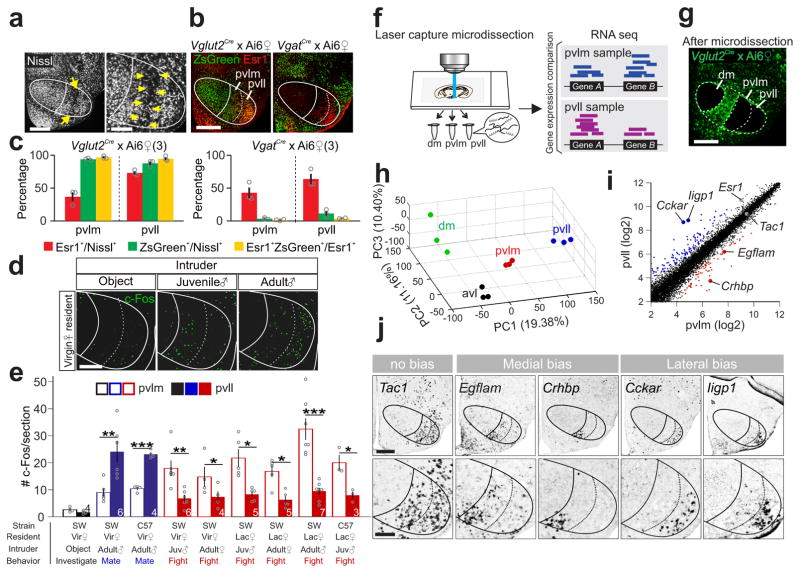
Figure 7. Female VMHvl has anatomically and molecularly distinct subdivisions.
(a) Nissl staining illustrating the boundary (yellow arrows) between female VMHpvlm and VMHpvll. Scale bars (left and right): 300 and 150 μm. (b) Overlay of Esr1 (red) and ZsGreen (green) in the VMHvl of a female Vglut2-ires-Cre × Ai6 mouse (left) and a female Vgat-ires-Cre × Ai6 mouse (right). Scale bar: 300 μm. (c) The percentage of Esr1+ (red), Vglut2+ (green, left) and Vgat+ (green, right) cells in the VMHpvll and VMHpvlm and the percentage of Esr1+ cells that overlap with Vglut2+ or Vgat+ cells (yellow). (N = 3 animals for each group). (d) Object investigation, fighting or mating induced c-Fos (green) in the VMHvl in virgin female mice. Scale bar = 150 μm. (e) Average number of c-Fos+ cells/section in the VMHpvlm and VMHpvll following object investigation (black), fighting (red) or mating (blue) in female mice. N = 3–7. paired t-test. *p < 0.05, **p < 0.01, ***p < 0.001. (f) Experimental scheme. (g) A brain section from a Vglut2-ires-Cre × Ai6 mouse after microdissection of VMHdm, VMHpvll and VMHpvlm. Scale bar: 300 μm. (h) RNAseq results of all samples from various VMHvl subregions mapped onto the principal component (PC) space. (i) Average normalized counts of each gene in the VMHpvlm (x-axis) and VMHpvll (y-axis). Red and blue dots represent genes with significantly biased expression (Benjamini and Hochberg method, p< 0.05, >1.2×, log2 scale). (j) In situs of 5 genes at the VMHvl that are indicated in (i). Scale bars (top and bottom): 300 and 150 μm. Data are presented as means ± s.e.m.. [AU Query: OK?] See Supplementary Table 2 for detailed statistics. See also Supplementary Figure 13.

