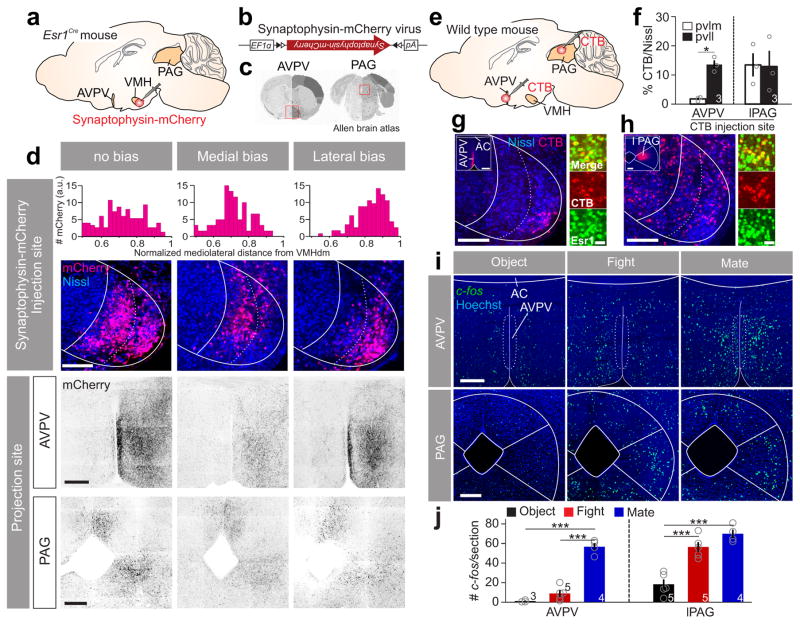
Figure 8. VMHpvlm and VMHpvll in female mice have distinct downstream targets.
(a, b) Experimental scheme for anterograde tracing. (c) The two projection sites of the VMHvl (red boxes) that are shown in (d). Images from Allen Brain Atlas. (d) Projection patterns in the AVPV and PAG in animals with primary infection in the whole VMHvl (left), VMHpvlm (middle) and VMHpvll (right). Scale bars (top to bottom): 150, 300 and 300 μm. Top bar graphs show the distributions of infected neurons in the VMHvl along the medial-lateral axis. (e) Experimental scheme of retrograde tracing. (f) Percentage of neurons in the VMHplvm or VMHpvll that were retrogradely labeled from AVPV (left) or PAG (right). Paired t-test. *p < 0.05. (g, h) Left large image shows neurons in the VMHvl that are retrogradely labeled (red) from (g) AVPV or (h) PAG. Insets show the injection sites. Scale bars: 150 μm and 300 μm (insets); Right images show the overlap between the CTB labeling (red) and Esr1 (green). Scale bar: 20 μm. (i) c-fos mRNA expression in the AVPV or PAG after various testing conditions. Scale bars: 300 μm. (j) Average number of c-fos expressing cells per section in the AVPV (left) and PAG (right) after various testing conditions. One-way ANOVA followed by Tukey’s multiple comparisons. ***p < 0.001. Data are presented as means ± s.e.m. [AU Query: OK?] See Supplementary Table 2 for detailed statistics. See also Supplementary Figure 14.

