
Figure 1.
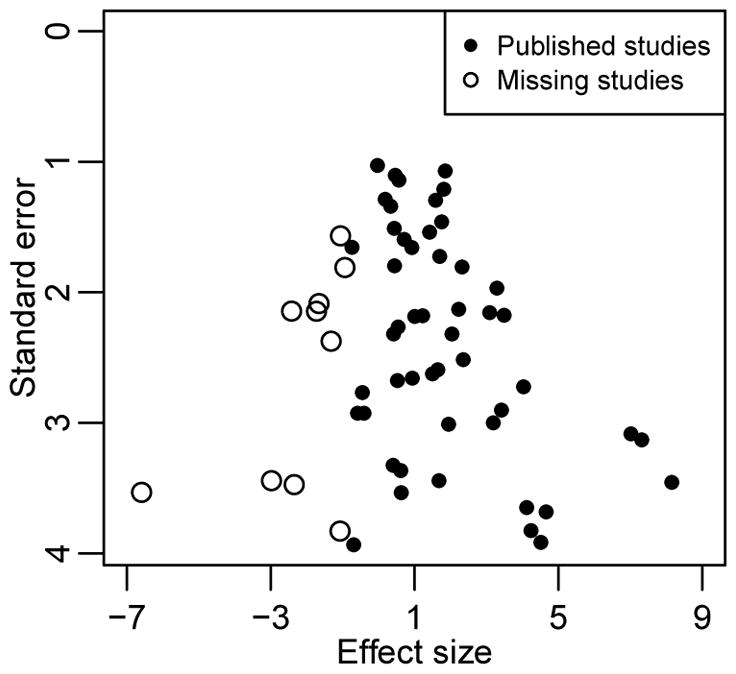
The funnel plot of a simulated meta-analysis containing 60 studies. The 10 studies with the most negative effect sizes were suppressed due to publication bias, and the remaining 50 studies were “published”.
Official websites use .gov
A
.gov website belongs to an official
government organization in the United States.
Secure .gov websites use HTTPS
A lock (
) or https:// means you've safely
connected to the .gov website. Share sensitive
information only on official, secure websites.
The funnel plot of a simulated meta-analysis containing 60 studies. The 10 studies with the most negative effect sizes were suppressed due to publication bias, and the remaining 50 studies were “published”.