Fig. 4.

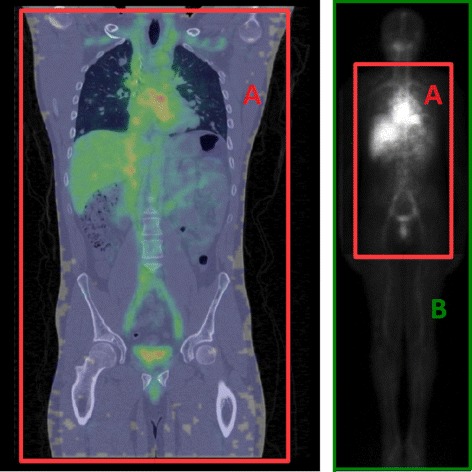
On the left side, SPECT/CT fusion image of a Synfrizz patient. On the right, whole body planar image after attenuation and scatter correction. The SPECT FOV is represented on both image by the red rectangle

On the left side, SPECT/CT fusion image of a Synfrizz patient. On the right, whole body planar image after attenuation and scatter correction. The SPECT FOV is represented on both image by the red rectangle