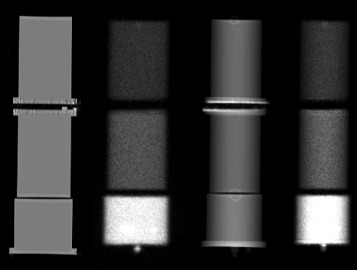
Fig. 7.

Illustration of the AC in the WBS. From left to right, a coronal view of the phantoms used, the geometrical mean of the planar scintigraphy corrected from SC, the attenuation correction factor map obained from the CT, and the WBS corrected from scatter and attenuation
