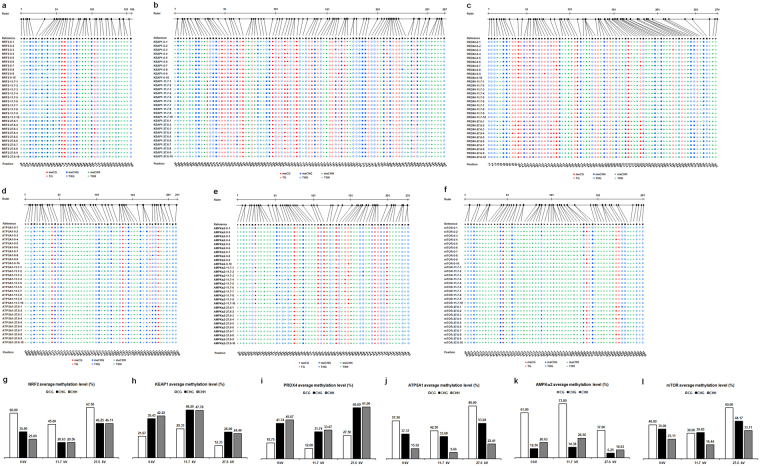
Figure 2.
Cytosine methylation analysis of chicken spermatozoa. Cytosine methylation of (a) NRF2, (b) KEAP1, (c) PRDX4, (d) ATP5A1, (e) AMPKα2, and (f) mTOR were analyzed using CyMATE. Lengths of sequenced regions and position of cytosine are shown schematically. The order of the individual sequences of ten clones is listed on the left. 0 represents the control group; 11.7 represents plasma-treated group at 11.7 kV for 20 s; and 27.6 represents plasma-treated group at 27.6 kV for 20 s. The reference sequence is shown in the first line. The sequence is distinguished by circles for CG, squares for CHG, and triangles for CHH. Filled symbols represent methylated cytosine, and open symbols represent unmethylated cytosine. Average methylation levels for CG, CHG, and CHH of (g) NRF2, (h) KEAP1, (i) PRDX4, (j) ATP5A1, (k) AMPKα2, and (l) mTOR.

