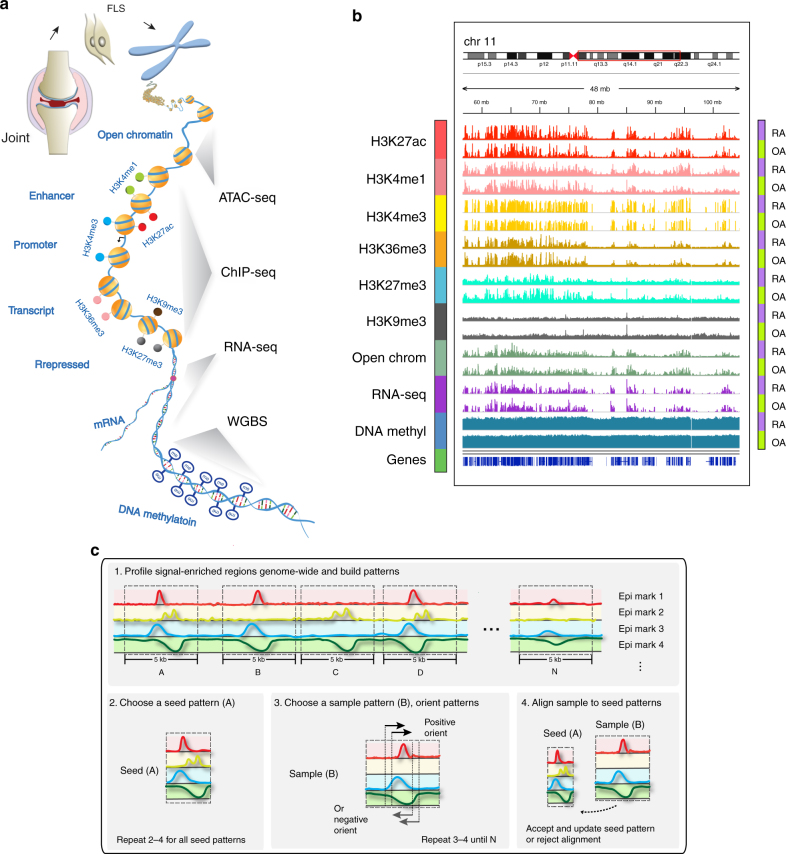
Fig. 1.
Overview of RA integrative analysis pipeline. a Schematic representation of major omics methods used in RA FLS. b Epigenomic landscape of RA FLS with six histone modifications, open chromatin, RNA-seq and DNA methylation. The figure shows an example of the relative signal intensity across a selected region of the genome for each mark in RA and OA FLS. In addition, the locations across chromosomes for the selected regions are indicated. c Schematic overview of how EpiSig integrates different epigenetic marks. The algorithm detects significant signals from sequencing data in 5 kb genome regions, clusters regions based on similar epigenomic patterns, and identify epigenomically similar regions

