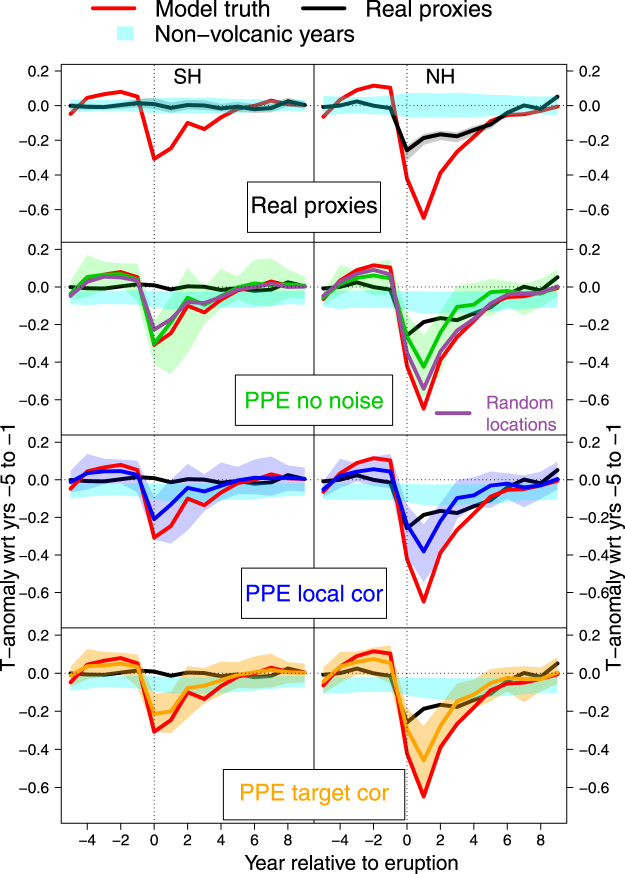
Figure 5.
Superposed Epoch Analysis of the temperature response to volcanic eruptions. SH (left) and NH (right) temperature anomalies relative to 5-year pre-eruption means. Lines (shading) represent ensemble medians (9–95% range). Red: model truth, black: real proxies, other colors: PPE. Cyan shading is the 5–95% range of monte-carlo sampled years during non-volcanic periods. Distributions are across all model simulations and ensemble members. Model truth and real proxy data are shown in all panels for better comparison.

