Fig. 2.
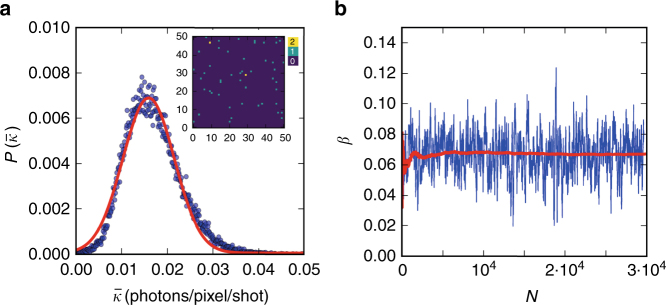
Speckle contrast analysis. a The mean photon density probability distribution of 3·104 shots recorded at T = 296 K with pulse duration δt = 50 fs. In the inset is shown a fraction of the ePix detector for a single shot with photons/pixel, which consists mainly of pixels with 1 photon count (green) and 2 photon counts (yellow). The solid red line depicts a Gaussian fit. b The speckle contrast β as a function of number of shots N. Here is shown the running average over 120 shots (blue) and the cumulative average (red)

