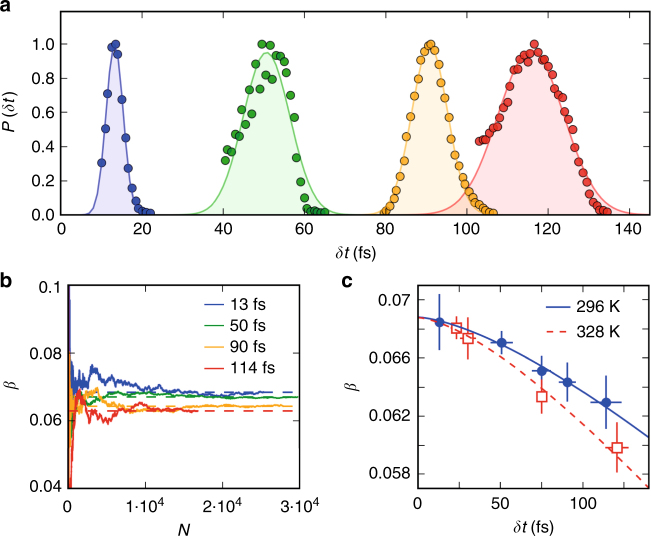
Fig. 3.
Pulse duration dependence. a The temporal probability distribution of X-ray shots for variable target pulse durations δt. b The cumulative average of the speckle contrast β for increasing number of shots N at T = 296 K for different target pulse durations as indicated in the legend. The dashed lines indicate the total average. c Speckle contrast β as a function of pulse duration δt for two different temperatures T = 296 K and 328 K. The maximum contrast β0 for the current settings is estimated (β0 = 0.069 ± 0.001) by its value at δt = 0. The vertical error bars are the standard error and the horizontal the FWHM of the pulse duration distribution. The solid and dashed lines are fits to the experimental data

